Figure 3.
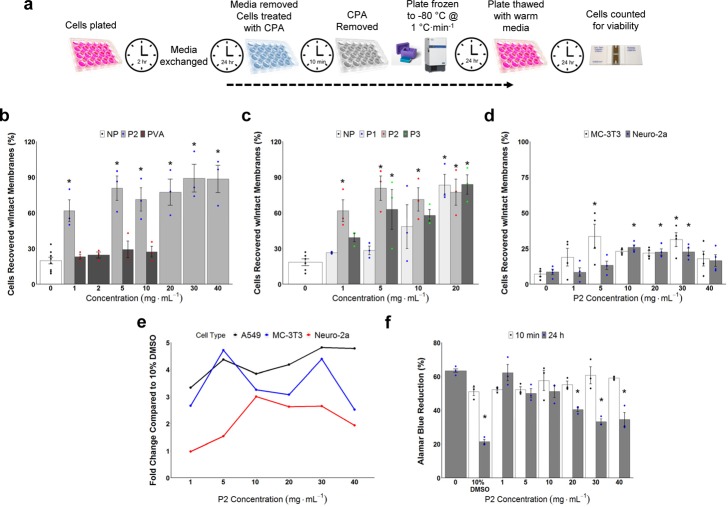
Cell monolayer cryopreservation and cytotoxicity. Recovered cells were counted by trypan blue exclusion assay relative to unfrozen controls. All cells were cryopreserved for 24 h at −80 °C and then 24 h post-thaw incubation. (a) Schematic of the cryopreservation/thawing protocol; (b) Post-thaw cell recovery (as % of unfrozen controls) of A549 cells cryopreserved with 10% DMSO plus variable concentrations of P2 or PVA (NP = no polymer) (N = 39, P = 0.000000002, *P < 0.001 from NP w/10% DMSO). The data represent the mean ± SEM of three independent experiments with two nested replicates each. (c) Effect of polymer molecular weight (P1–P3, NP = no polymer) and concentration on A549 cell recovery (N = 42, P = 0.000006, *P < 0.001 from NP w/10% DMSO). The data represent the mean ± SEM of three independent experiments with two nested replicates each. (d) Post-thaw recovery of Neuro-2a and MC-3T3 cells after cryopreservation with 10% DMSO plus variable concentrations of P2. The data represent the mean ± SEM of four independent experiments with two nested replicates each (Neuro-2a: N = 28, P = 0.0005, *P < 0.001 from Neuro-2a w/0 mg mL–1P2; MC-3T3: N = 28, P = 0.02, *P < 0.01 from MC-3T3 w/0 mg mL–1P2). (e) Fold change (relative to 10% DMSO) post-thaw recovery for all cell lines as a function of P2 concentration. (f) Cytotoxicity of P2 against A549 cells; incubation time is 10 min or 24 h (N = 48, P = 0.0000000001, *P < 0.001 from 0 mg mL–1P2). The data represent the mean ± SEM of three independent experiments.

