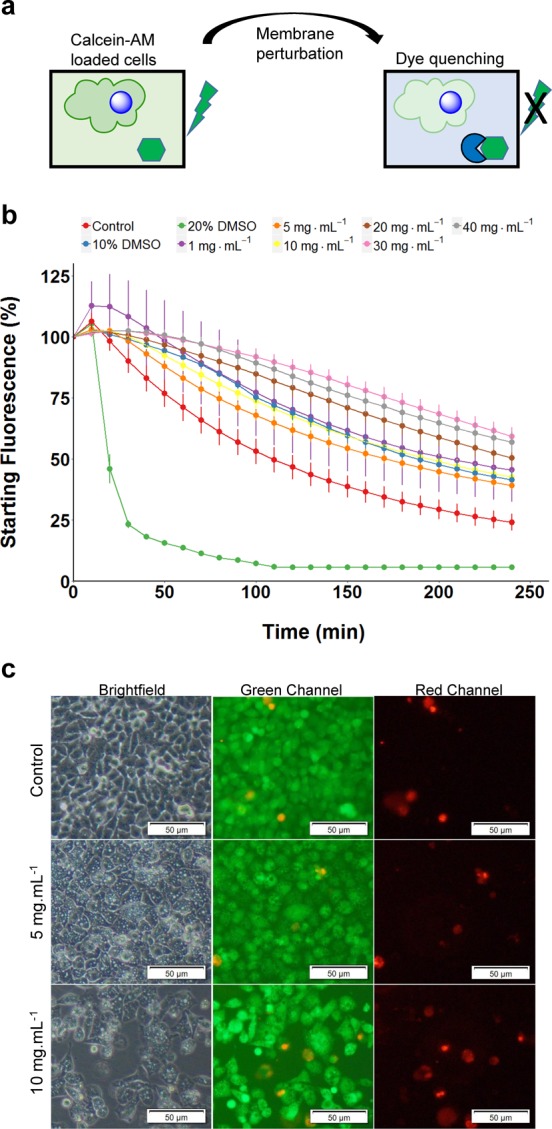
Figure 6.

Impact of polymer on the membrane flux and permeability. (a) Graphical depiction of dye leakage assay. (b) Continuous live cell dye leakage assay from calcein-AM loaded A549 cells treated with varying concentrations of P2. Decreasing fluorescence corresponds to an increased membrane flux. (c) LIVE/DEAD staining of A549 cells after 24 h of incubation with P2. The scale bar is 50 μm.
