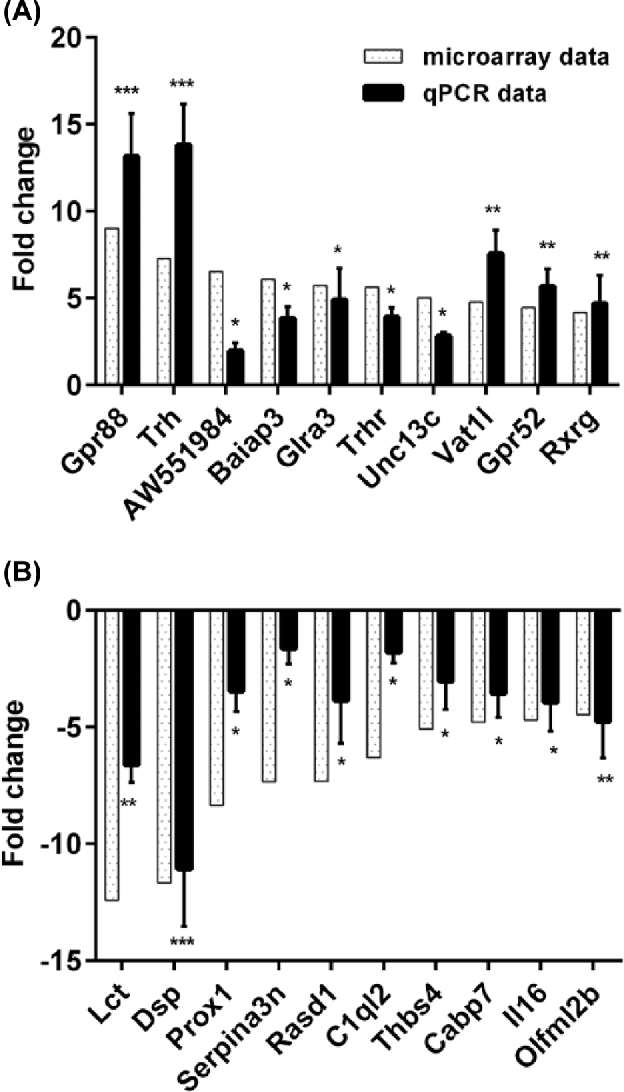
Figure 3.

Gene expression changes in the insula. Comparison of qPCR and microarray data for top 10 upregulated genes (A) and downregulated genes (B) in insula. Relative fold changes in expression between endometriosis and sham mice, as detected by qPCR (light gray bars), were in agreement with microarray data (black bars) (*P < 0.05; **P < 0.01; ***P < 0.005). N = 20 per group.
