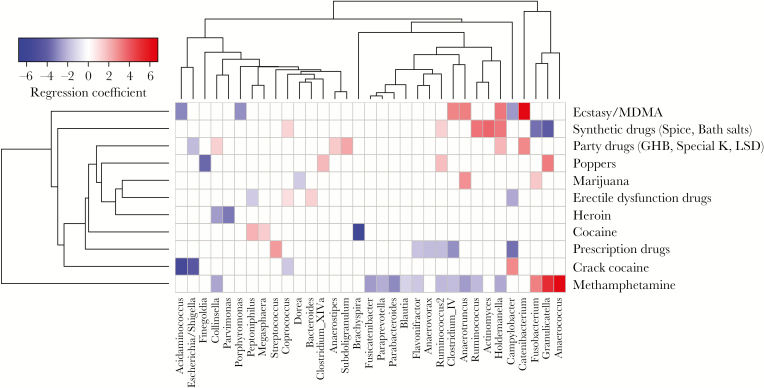
Figure 3.
Associations between microbiome composition and substance use. Heat map showing associations between self-reported substance use and microbiome composition after controlling for participant identifier, CD4+ T-cell counts, and HIV-1 RNA copy numbers. Red shading indicates positive associations, and blue shading indicates negative associations. Intensity of shading refers to the relative strength of the association determined by regression coefficients from 0-inflated negative binomial regression analysis. Only genera that were associated with a substance use variable with an adjusted P value of <.05 are shown.

