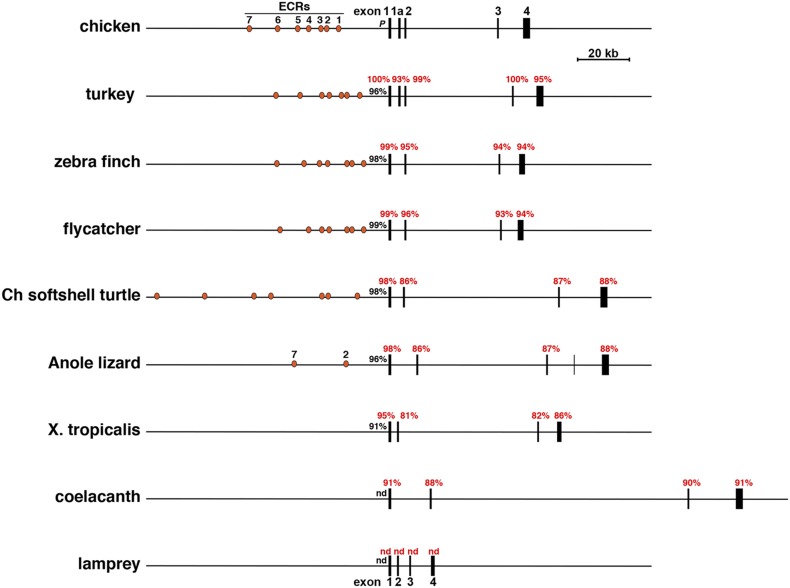
Figure 2.
Comparison of selected vertebrate Igf1 genes. Schematics of chicken Igf1 and eight other Igf1 genes and loci are shown. Exons are illustrated as boxes, introns and flanking DNA as horizontal lines, and ECRs 1 to 7 as orange ovals. A scale bar is indicated. The percentage of nucleotide identity with different parts of chicken Igf1 is listed for each gene (red for exons, black for promoters). Ch, Chinese; nd, no identity detected; X, Xenopus.

