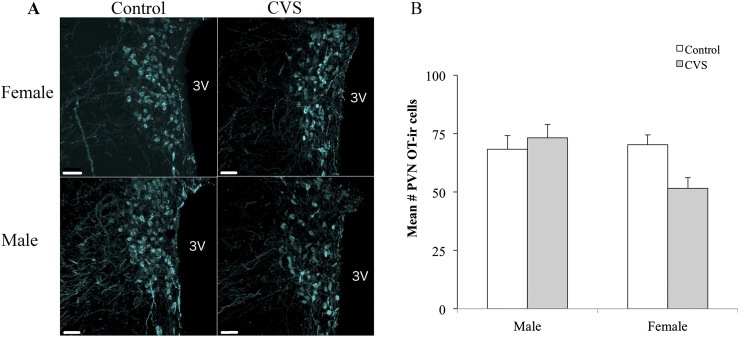
Figure 5.
OT-ir was reduced in the PVN of female CVS-treated mice. (A) Representative photomicrographs showing reduced numbers of OT-immunoreactive neurons in the PVN. (B) Cell counts represent a unilateral PVN, averaged across three to six images per mouse encompassing the anterior, mid, and posterior subregions. Each bar represents the mean ± SEM (n = 5 to 7 mice per group). Each point indicates the value for an individual subject. 3V, third ventricle.

