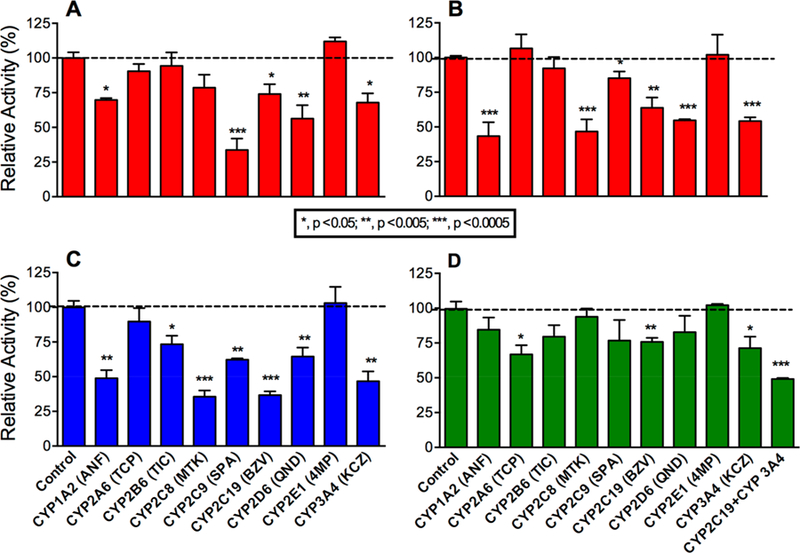
Figure 2.

Inhibitor phenotyping of terbinafine metabolism by human liver microsomes. As described in Experimental Procedures, terbinafine (200 μM) metabolism to TBF-A (A) and the co-metabolite N-methyl-1-naphthyl methylamine (B) from Pathway 1.1, desmethyl-terbinafine (C) from Pathway 2.1, and 1-naphthaldehyde (D) from Pathway 3.1 was blocked by P450-specific inhibitors. All other potential metabolites for these reactions were not detected consistently or at all. Error bars denote standard deviations. Inhibitors used are as follows: 16 μM α-naphthoflavone (ANF) for CYP1A2, 2 μM tranylcypromine (TCP) for CYP2A6, 3 μM ticlopidine (TIC) for CYP2B6, 16 μM montelukast (MTK) for CYP2C8, 10 μM sulfaphenazole (SPA) for CYP2C9, 16 μM (+)-N-3-benzylnirvanol (BZV) for CYP2C19, 2 μM quinidine (QND) for CYP2D6, 30 μM 4-methylpyrazole (4MP) for CYP2E1, and 1 μM ketoconazole (KCZ) for CYP3A4 as well as a combined 16 μM (+)-N-3-benzylnirvanol and 1 μM ketoconazole for the 1-naphthaldehyde reaction. A total of 9−15 experimental reactions were carried out for these studies.
