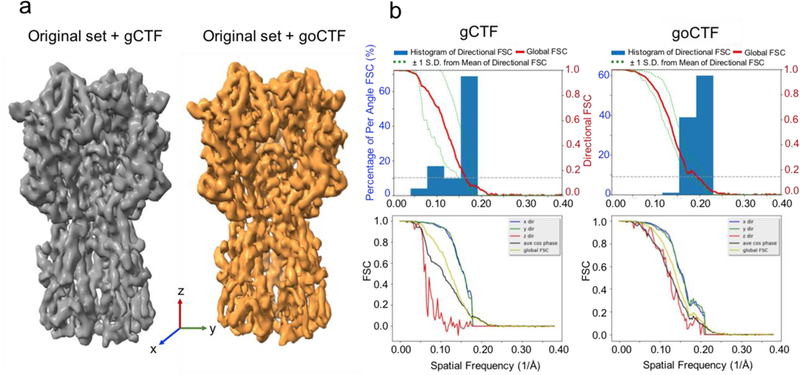
Fig. 7.

Benchmark in 3D refinement using cryoSPARC with published dataset (EMPIAR-10097) containing influenza hemagglutinin trimer. (a) Isosurface rendering of the 3D map results from the original dataset (130,000 particles) processed by gCTF shown in grey, and the original dataset updated defocus by goCTF shown in orange. (b) Directional 3DFSC plots shown from gCTF (left) and goCTF (right).
