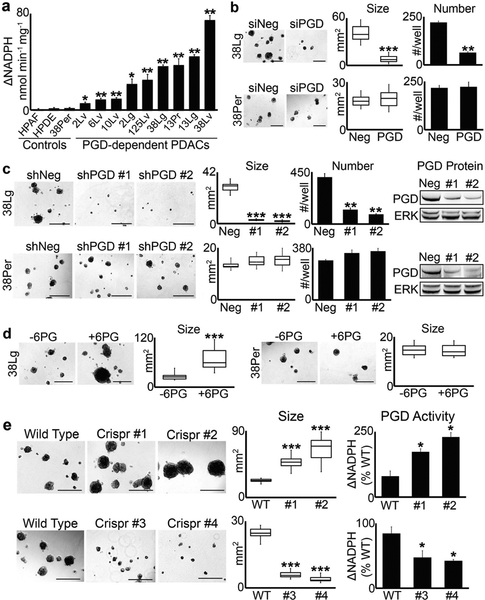
Fig. 1.
PGD enzyme activity dictates tumorigenic capacity. a PGD enzyme assays were performed on cell extracts isolated from each low passage (<15), sequence-verified clonal PDAC distant metastasis, and control cells as indicated. For all 2D culture expansions, cells were grown in DMEM with 10% FBS and were free of mycoplasma (Sigma LookOut). For enzyme assays, cells were lysed and the extracts filtered through Amicon 10K columns to remove endogenous metabolites. Protein concentration was then measured with BCA (Pierce), and 10 μg of protein (in 10 μl) was incubated with 0.2 mM NADP (Sigma) and 0.4 mM 6PG (Sigma) in 90 μl of reaction buffer (50 mM Tris, pH = 8; 1 mM MgCl2; complete EDTA-free protease inhibitors) in a 96-well plate. NADPH absorbance (340 nm) was measured over 10 min and nmol NADPH produced was determined from a standard curve. For these and all subsequent enzyme assay experiments, measurements were performed in triplicate, nonspecific background absorbance was subtracted from each replicate, and NADPH production rates (ΔNADPH) were calculated as nmol NADPH/min/mg protein. b 38Lg and 38Per cells were transfected with control (siNeg) or PGD siRNAs as described [13], trypsinized into single cells, and grown in 3D suspension Matrigel assays, also as described in [13]. For these and all other Matrigel suspension assays, 4000 cells/well were plated into low attachment 24-well plates in quadruplicate, and tumoroid growth monitored over a period of approximately 3 weeks with 100 μl media (DMEM with 5% Matrigel and 2% FBS) feeds every 5–7 days. Tumor numbers were counted at the end of the experiment, and tumor area was quantified using CellSens software (n = 15 tumors across 5–10 microscopic fields). c Stable 38Lg and 38Per cell lines were generated by lentiviral transduction and puromycin selection using non-targeting control shRNAs (Sigma) and two separate PGD shRNAs (shRNA #1: genic region; shRNA #2: 3′-UTR; Sigma TRCN274974 and TRCN274976). Although proliferation rates in 2D were not impaired (data not shown), 3D tumoroid growth was significantly impaired in 38Lg shPGD cells. Western blots demonstrated efficient knockdown of PGD protein in 38Lg and the 38Per controls, with no effects on total ERK 1/2 levels (antibodies: Cell Signaling 13389 and 4696). d 38Lg and 38Per cells were plated in 3D with complete media supplemented with (+6PG) or without (−6PG) 5 mM 6PG. 6PG significantly increased tumoroid size in 38Lg. e Four separate Crispr clones (#1, #2, #3, and #4) were generated for 38Lg with viral transduction followed by puromycin selection using a Crisper sgRNA targeted to exon 8, which encodes the 6PG substrate binding region (Sigma LentiCrispr, ccctggaatacggcgtacccgtc). Effects on 3D tumoroid size mirrored PGD catalytic activity, as measured by PGD enzyme assays. For all experiments in this figure, statistical significance was calculated using 2-tailed t-tests (*p < 0.05; **p ≤ 0.001; ***p ≤ 0.0001)

