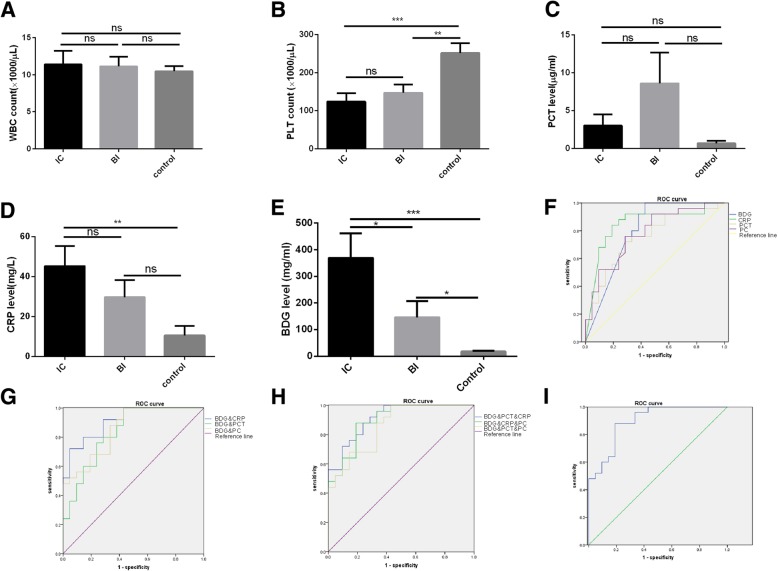
Fig. 1.
Comparison of the inflammation indicators between groups and their diagnostic value in IC. a The white blood cell count of the neonates in IC, BI and CTRL group. b The platelet count of the neonates in IC, BI and CTRL group. c The serum level of PCT in IC, BI and CTRL group. d The serum level of hsCRP in IC, BI and CTRL group. e The serum level of (1,3)-β-D-glucan was detected with GKT assay. f Showing is the ROC of BDG, CRP, PCT and PC alone in diagnose of IC. Blue line: BDG, green line: CRP, orange line: PCT, purple line: PC and yellow line: reference line. g showing is the combined ROC of BDG with CRP, PCT or PC. Blue line: BDG&CRP, green line: BDG&PCT, orange line: BDG&PC, purple line: reference line. h Showing is the combine ROC of three indicators. Blue line: BDG&CRP&PCT, green line: BDG&CRP&PC, orange line: BDG&PC&PCT, purple line: reference line. i showing is the combined ROC of BDG&CRP&PCT &PLT. ns: no significant, ***p < 0.001, **p < 0.01, *p < 0.05

