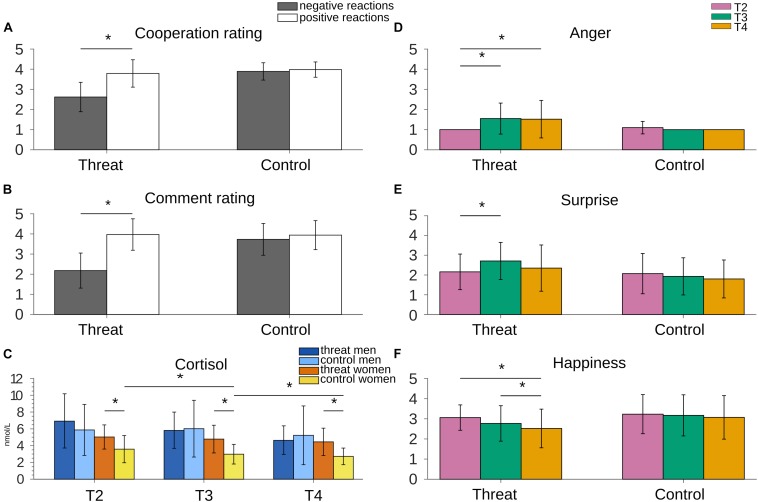
FIGURE 3.
(A) Willingness to cooperate was lower after negative reactions compared to positive reactions. As expected, no difference was present in the control group. (B) Negative reactions in the threat version of the VISTTA were rated significantly lower than reactions to the same topics in the control version. Also within-subject they were rated lower than the positive reactions in 10 topics. (C) Cortisol stayed stable in women in the threat group, but decreased in the control group. Men showed decreasing cortisol levels in both groups. For illustrative purposes only significant differences between women in both groups and the decay in the women control group are marked with an asterisk. (D) Anger increased from T2 to T3 in the threat group, compared to unchanged anger scores in the control group. (E) The threat version led to an increased score of surprise, whereas this score stayed stable in the control group. (F) Participants in the threat group reported decreased levels of happiness. The control version did not elicit such a decrease. Raw values were used to create the graphs, although some analyses used transformed scores. Error bars represent standard deviations. Asterisks indicate significant differences with p < 0.05.

