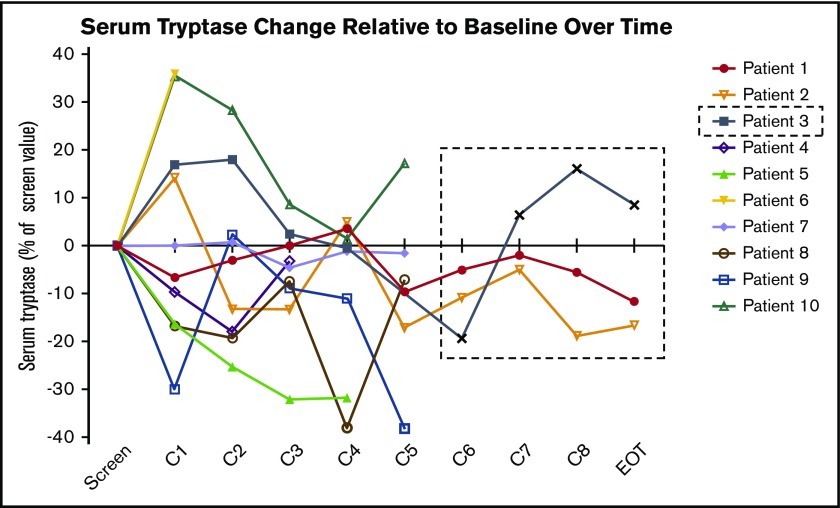
Figure 2.
Changes in serum tryptase levels on BV therapy. Serum tryptase activity level, represented for each patient as a percentage change relative to their pretreatment baseline, did not show durable reductions over the course of treatment. Patient 3 discontinued treatment after cycle 4 because of progressive disease, with subsequent values obtained during posttherapy monitoring shown within the dashed line box.

