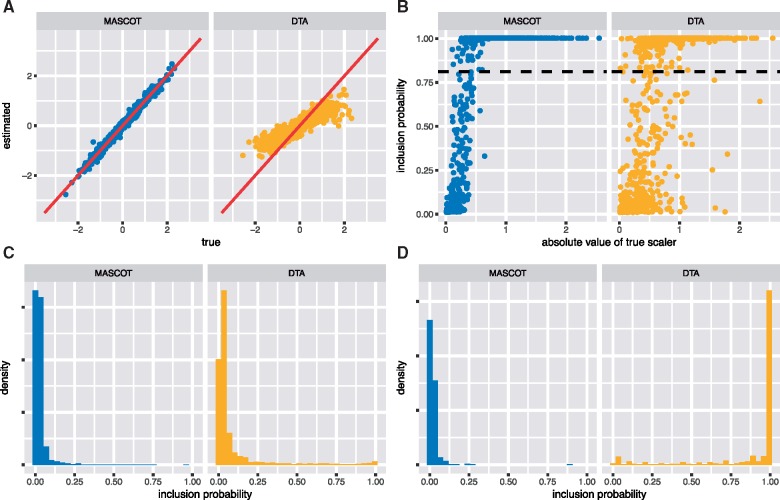
Figure 2.
Inference of coefficients and indicators using the generalized linear model versions of MASCOT and DTA based on fixed phylogenetic trees. (A) Inferred active coefficients (y-axis) versus the true coefficients for migration rate predictors using MASCOT (left) and DTA (right). (B) Probability of the indicator of active migration rate predictors to be 1 (y-axis) for the effective population size. The dashed line corresponds to a Bayes Factor of 10 for the predictor being included. (C) Histogram of inclusion probabilities from predictors that are not predicting migration rates. Therefore, the true value of these inclusion probabilities is 0 and predictors with large inclusion probabilities might be falsely considered as predicting migration rates. (D) Histogram of inclusion probabilities of indicators for sample number predictors. That is, the predictor that predicts migration into a state being proportional to the number of samples from that state. These predictors were not used to predict migration rates.

