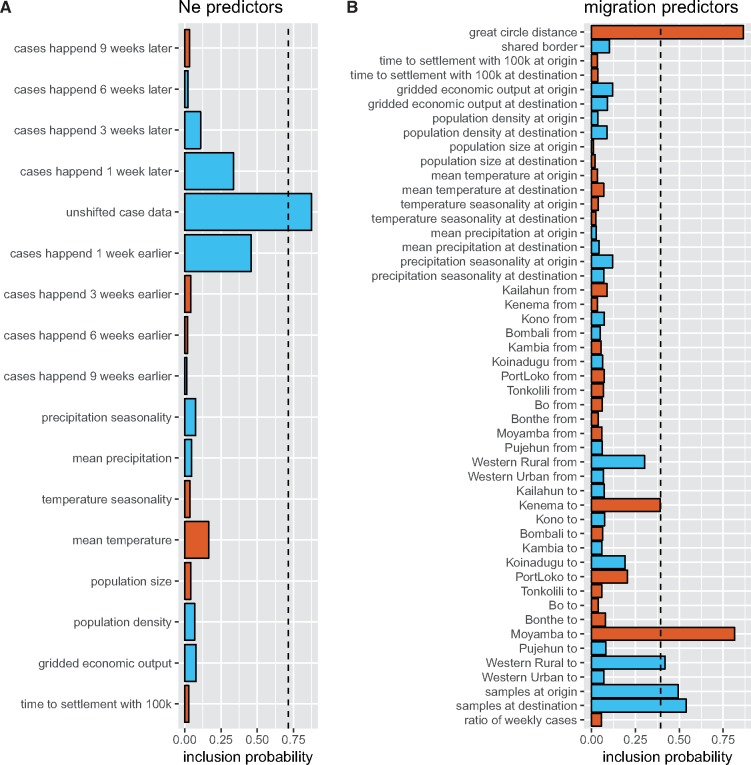
Figure 4.
Inferred predictors of the effective population sizes and migration rates for the Ebola analysis. (A) Inferred effective population size predictors. The x-axis shows the probability of the predictors being included in predicting the effective population sizes. Red bars are predictors for which the median value of the coefficient is negative and blue bars are predictors for which the median value of the coefficient is positive. The magnitude of the coefficient from a standardized predictor does not have a direct meaning or dimension. We therefore only plotted if a coefficient was inferred to be positive or negative, i.e. if the relationship between a predictor and the effective population size or migration rates is inverse or not. The case data predictor include the number of cases per week in a location. We additionally added eight predictors where the cases are assumed to have happened 1, 3, 6, and 9 weeks earlier or later. These are not inferred to strongly predict effective population sizes. (B) Inferred migration rate predictors. The x-axis shows the probability of the predictors being included in the migration model. ‘Origin’ and ‘from’ predictors predict the migration rate from a location. ‘Destination’ and ‘to’ predictors predict the migration rate into a location. The dashed line corresponds to a Bayes Factor of 10 for the predictor being included.

