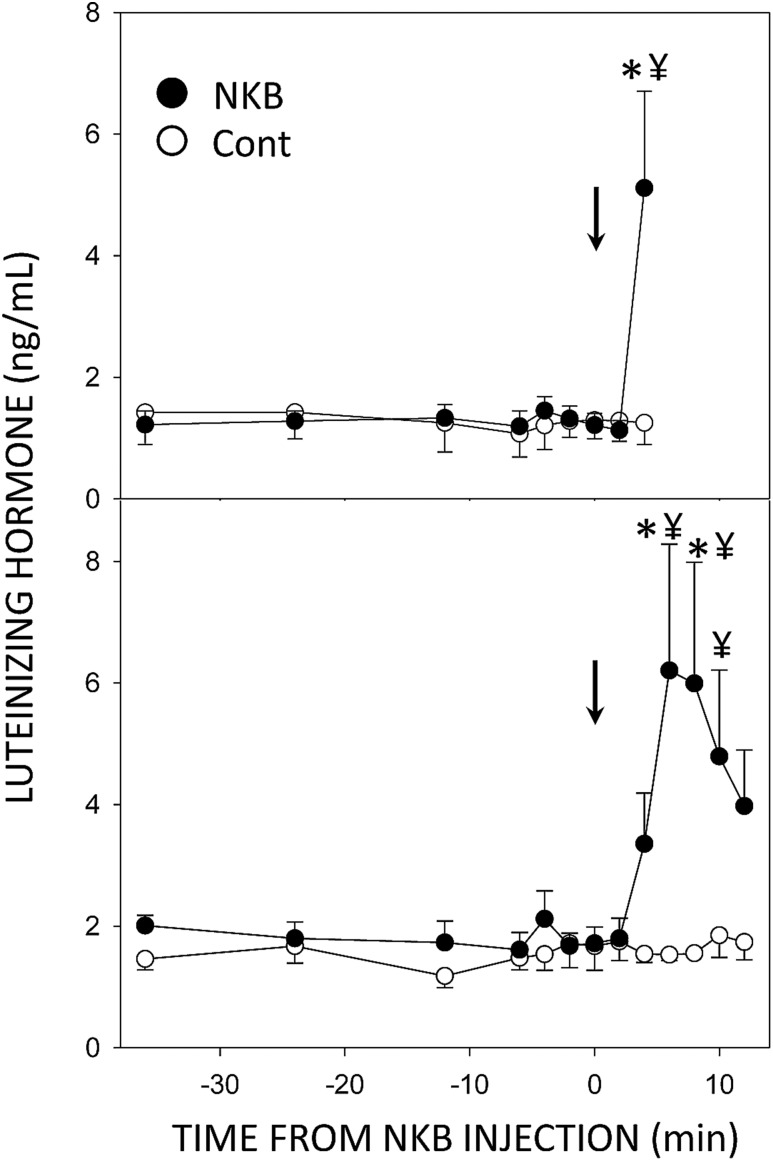
Figure 3.
Mean (±SEM) LH concentrations in ovary-intact anestrous ewes that received injections (arrows) of 100 µL of saline (○) or 0.2 nmol NKB (●). Top panel illustrates values from ewes in which tissue was collected 4 min after injection, and the bottom panel presents data from ewes in which tissue was collected 12 min after injection. *P < 0.05 vs concentrations prior to NKB treatment; ¥P < 0.05 vs saline control within time by two-way ANOVA with repeated measures.

