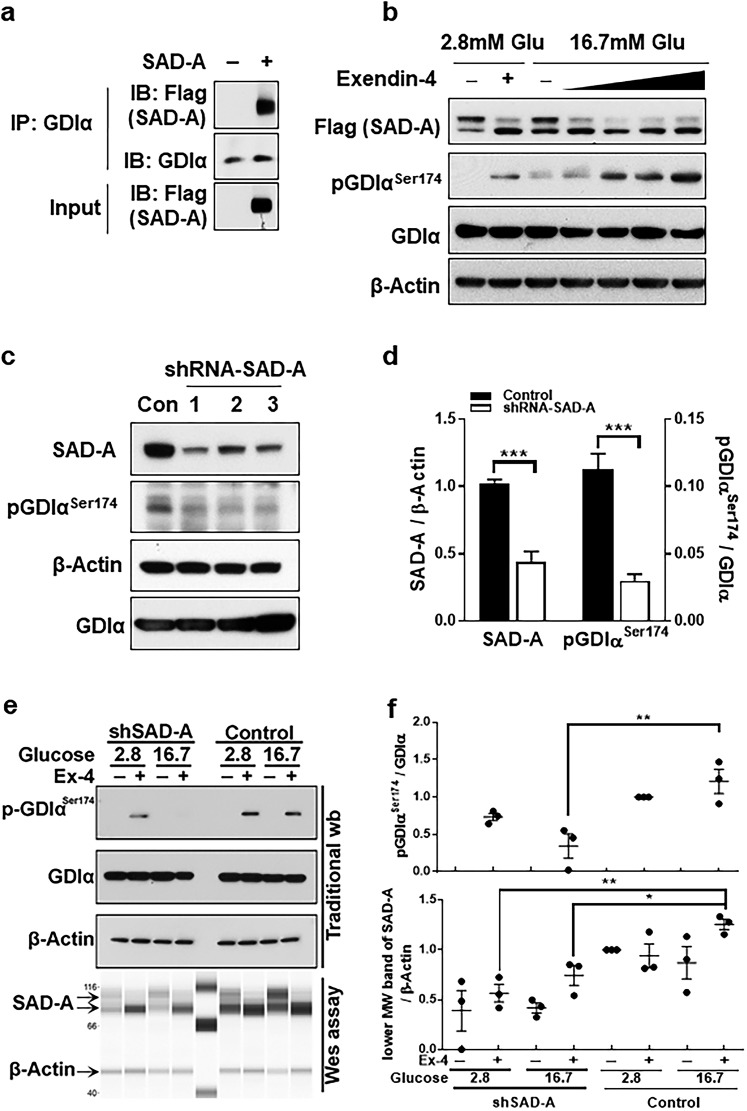
Figure 3.
SAD-A binds and phosphorylates GDIα at Ser174 during Exendin-4 (Ex-4) and glucose treatment in β cells. (a) Co-IP of SAD-A and endogenous GDIα from islets by using anti-GDIα antibodies. The islets were infected with recombinant adenoviruses overexpressing Flag-SAD-A or empty vector. The immunocomplexes were probed by western blot analysis using anti-Flag antibodies for SAD-A. (b) Ser174-GDIα was dose-dependently increased by SAD-A after stimulated by 16.7 mM glucose and Ex-4. INS-1 cells were transiently transfected with FLAG–SAD-A for 48 hours followed by 1 hour starvation in 1% fetal bovine serum 1640 at 2.8 mM glucose, the media were then changed with 0, 1, 6, 12, and 24 nM of Ex-4 together 16.7 mM glucose, or 12 nM Ex-4together 2.8 mM glucose. Collect cell lysate at 10 minutes and followed by western blot. (c) INS-1 cells were transiently transfected with expression vectors for three different shRNAs (lanes 1 through 3) targeted to endogenous SAD-A or a scrambled form as negative control (Con) followed by western blot analysis for the expression level of SAD-A, GDIα, and Ser174-GDIα. β-actin was used as an internal control for protein loading. (d) Quantification of SAD-A and Ser174-GDIα level in panel (c). *** P < 0.001 (t test). (e) Ser174-GDIα was analyzed after shRNA-mediated knockdown of SAD-A in the presence or absence of high glucose and 24 nM of (Ex-4). (f) Quantification of SAD-A and Ser174-GDIα level in panel (e). [(f), upper panel] Ser174-GDIα density analysis. Two-way repeated-measure ANOVA [column: control and shSAD-A; row: group 1 (2.8 mM Glu + 12 nM Ex-4) and group 2 (16.7 mM Glu + 12 nM Ex-4)] revealed a significant main effect of column [F(1, 8) = 22.98, P = 0.0014] and a nonsignificant effect of row [F(1, 8) = 0.5853, P = 0.4662] and a significant interaction between factors [F(1, 8) = 6.443, P = 0.0348]. ** P < 0.01 (post hoc comparisons with Tukey test correction). [(f), lower panel] 85-Kd (lower MW) band of SAD-A density analysis. Two-way repeated-measure ANOVA [column: control and shSAD-A; row: group 1 (2.8 mM Glu + 12 nM Ex-4) and group 2 (16.7 mM Glu + 12 nM Ex-4)] revealed a significant main effect of column [F(1, 8) = 22.34, P = 0.0015] and a significant effect of row [F(1, 8) = 6.903, P = 0.0303] and nonsignificant interaction between factors [F(1, 8) = 0.5366, P = 0.4847]. *P < 0.05 and **P < 0.01 (post hoc comparisons with Tukey test correction). IB, immunoblotting; IP, immunoprecipitation; wb, western blot.

