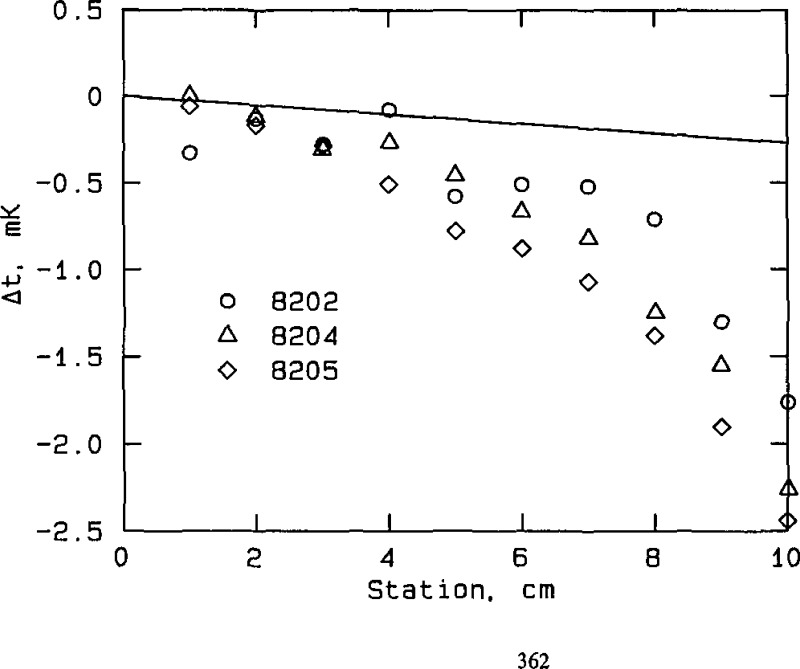
Figure 10.
Effect of immersion in zinc cell at the freezing point, NBS thermometers, plotted from the data in table A3b. “Station” is the vertical location of the thermometer in the cell well; it represents the elevation of the thermometer, in cm, above full immersion. The thermometer is fully immersed and resting on the bottom of the cell well at station 0. Δ t is the temperature equivalent of the difference in thermometer resistance, measured when the thermometer is fully immersed at station 0 and when it is elevated to the indicated station. The straight line represents the expected temperature gradient due to the hydrostatic pressure of the liquid zinc.

