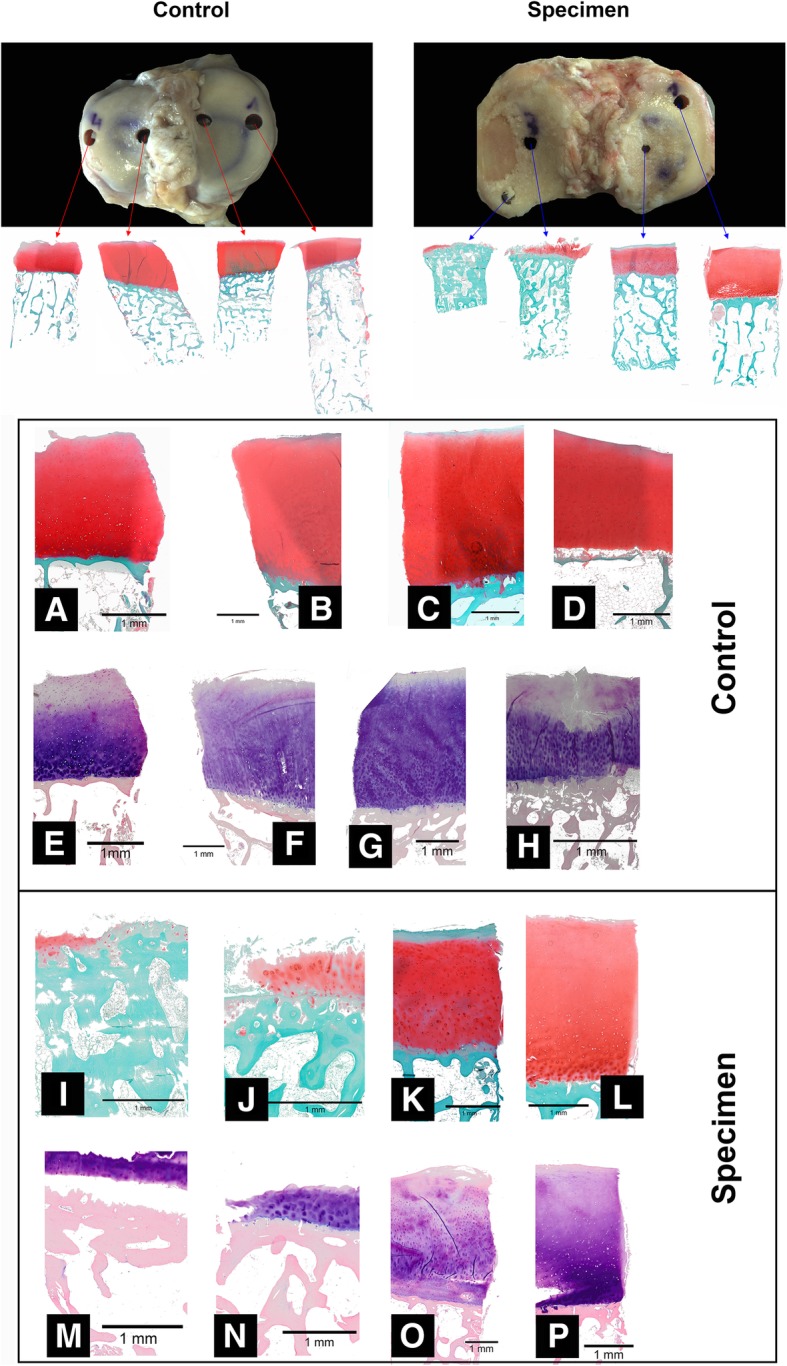
Fig. 3.

Overview of taken samples for histological examinations: control vs specimen. Comparison of Safranin O staining (a–d) and Giemsa staining: control group, a–d Safranin O staining and e–h Giemsa staining; specimen, i–l Safranin O staining and (m–p) Giemsa staining (enlargements of the images for control and specimen); black bar = 1 mm. Images were taken with Olympus BX-53
