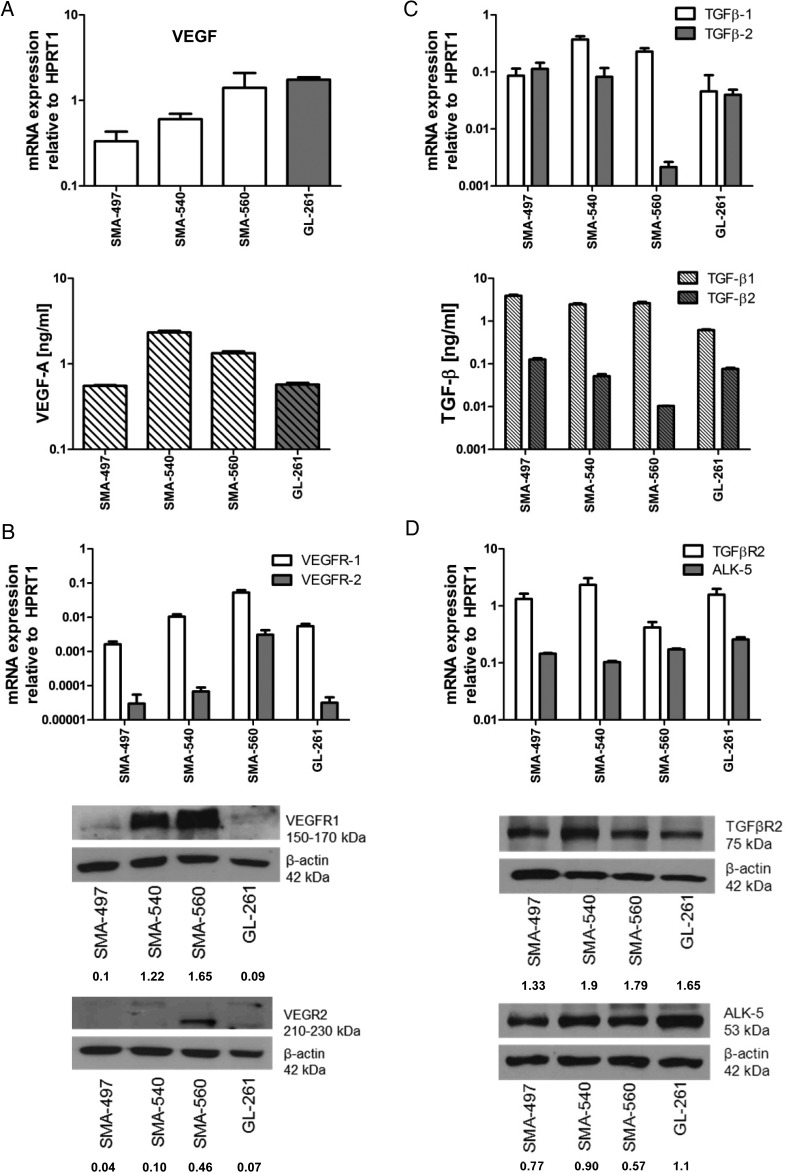
Fig. 1.
Expression of VEGF and TGF-β pathway ligands and receptors in mouse glioma models in vitro. SMA-497, SMA-540, SMA-560, and GL-261 cells were studied for gene expression. (A) VEGF expression determined by real-time (RT)-PCR for mRNA (top) and by enzyme-linked immunosorbent assay (ELISA) for protein in the supernatant (bottom) in vitro. (B) VEGFR1/2 expression determined by RT-PCR (top) and immunoblot (bottom) in vitro. (C) TGF-β1/2 expression determined by RT-PCR (top) and ELISA in the supernatant (bottom) in vitro. (D) TGF-βR2 and ALK-5 expression determined by RT-PCR (top) and immunoblot (bottom) in vitro. Values of densitometric analysis relative to β-actin are shown below the immunoblot panels in (B) and (D). HPRT1, hypoxanthine phosphoribosyltransferase 1.

