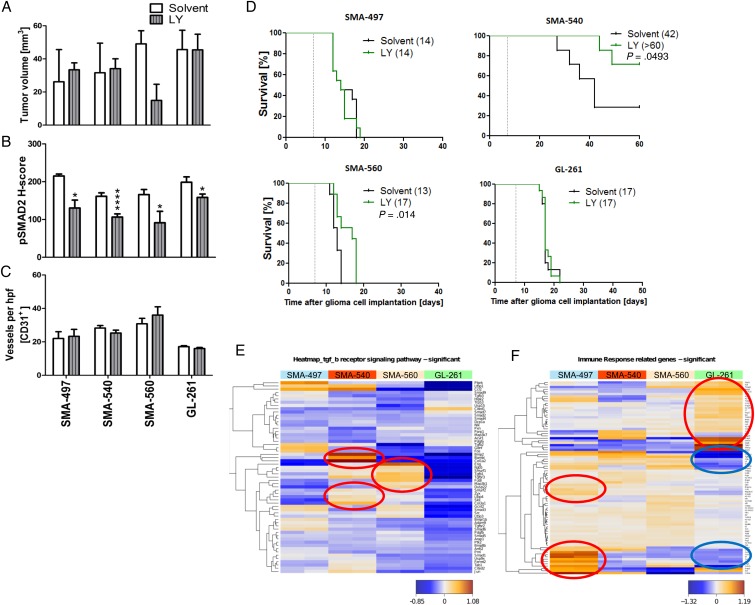
Fig. 3.
Differential effects of LY2157299 on the growth of murine gliomas. Mice intracranially implanted with SMA-497, SMA-540, SMA-560, or GL-261 cells were treated daily with LY2157299 at 150 mg/kg or control solvent from day 7 on. Brain sections (early-stage) were analyzed. (A) Tumor volumes. (B) pSMAD2 and CD31+ capillaries. (C) Data are expressed as mean + SEM (*P < .05, ****P < .0001, unpaired Student's t-test, LY2157299 vs solvent). (D) Kaplan–Meier survival curves of glioma-bearing mice (log-rank test was considered significant for P < .05). (E, F) Gene expression heatmaps were obtained by unsupervised comparison of genes differentially expressed in the 4 mouse glioma cell lines for the TGF-β signaling (E) and immune response (F) pathways. The heatmaps indicate high to low expression levels as red to blue color coding. Up- or downregulated gene clusters in SMA-497 and GL-261 cells are encircled in red or blue. hpf, high-powered field.

