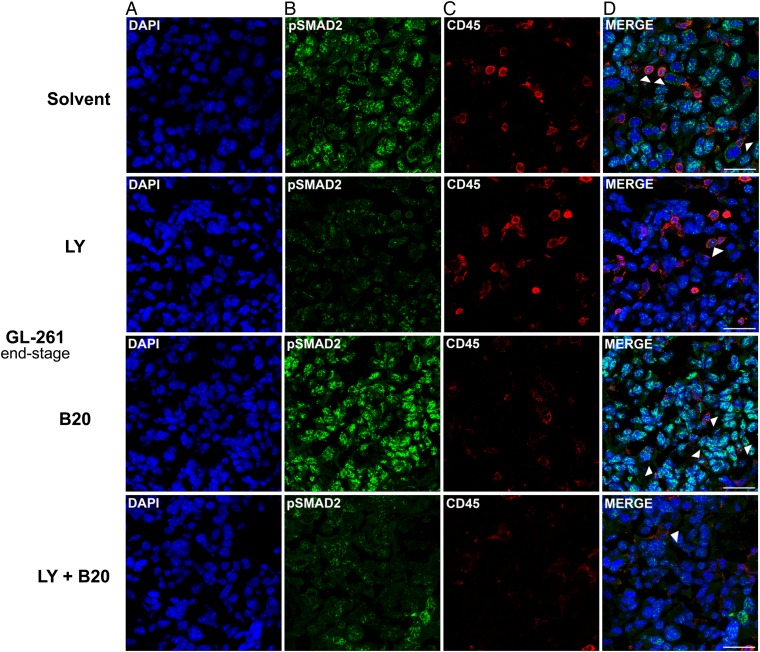
Fig. 6.
Modulation of pSMAD2 levels and tumor immune cell infiltration in B20 and LY2157299 cotreated GL-261 syngeneic model in vivo. Brain sections (end-stage) were examined. Staining of tumor sections was assessed with (A) 4′,6′-diamidino-2-phenylindole (DAPI) (blue ), (B) pSMAD2 (green), and (C) CD45 (red). Merged images are shown in (D). CD45+/pSMAD2+ leukocytes are marked by arrowheads. Scale bars correspond to 50 µm.

