Fig. 3.
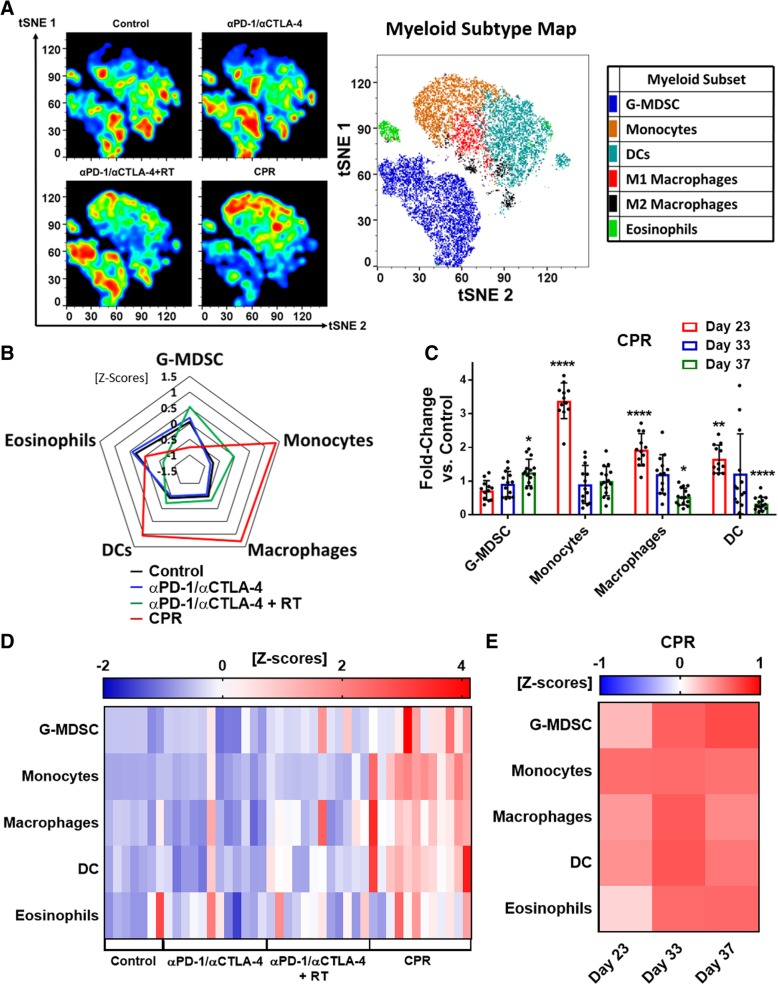
CPR favorably remodels the tumor and lymph node myeloid microenvironment. Mice bearing similarly established mEER tumors were treated and harvested after the first week of treatment (day 23) for assessment of myeloid cellular changes using flow cytometry in both the tumor (a-c) and the tdLN (d and e; see Additional file 11: Figure S11 for myeloid gating strategy). a Myeloid-focused tSNE (among intratumoral CD11b+ and/or CD11c+ cells) showing cumulative plots for each treatment group with corresponding myeloid subtype color map (right; N = 1 representative of 2; n = 5–6 per group). b Radar plot showing z-scores of myeloid sub-type percentages (among CD45+ cells) between treatment groups (N = 2; n = 10–12 per group). c CPR treated mice were assessed by flow at early (day 23), intermediate (day 33), and late (day 37) treatment timepoints and compared to tumor-size matched control mice for each of the myeloid subsets. Data shows fold-changes of intratumoral myeloid subtype percentages between CPR and control mice (Tukey’s multiple comparison test; N = 2; n = 11–13 per group, each dot represents an individual mouse). d Heatmap showing individual mouse z-scores for myeloid subtype percentage changes by treatment in the tdLN at day 23 of treatment (N = 2; n = 8–12 per group). e Heatmap showing average z-scores of myeloid subtypes for CPR treated mice compared to tumor-sized matched control mice (N = 2; n = 11–13 per group). *p < 0.05; **p < 0.01; ****p < 0.0001

