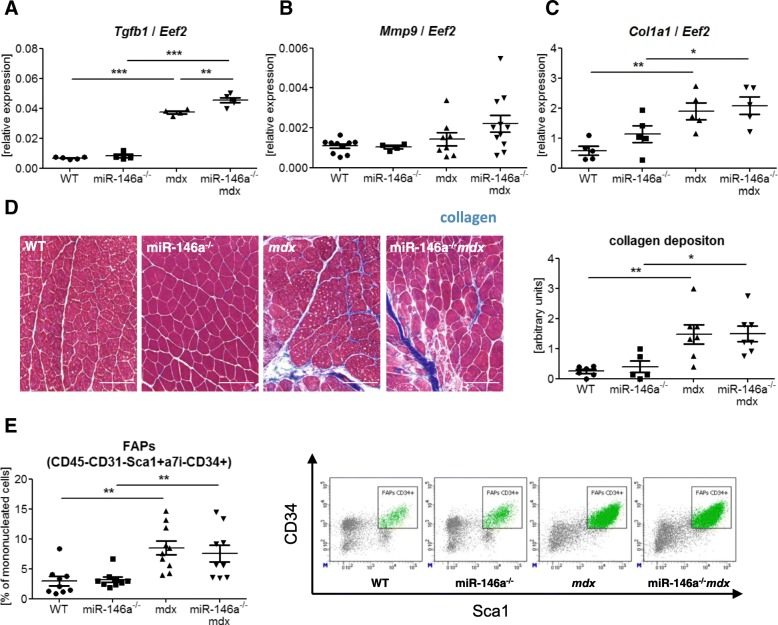
Fig. 8.
Fibrosis in WT, miR-146a−/−, mdx, and miR-146a−/−mdx hind limb muscles. a Tgfb1, b Mmp-9, and c Col1a1 level in GM; qRT-PCR. d Semi-quantitative analysis of collagen deposition in GM; trichome staining; representative photos. e Percentage of FAPs; (CD45−CD31−Sca1+α7integrin−CD34+); flow cytometry. Mean +/− SEM; n = 5–11; *− p ≤ 0.05; **− p ≤ 0.01; ***− p ≤ 0.001. Scale bars 100 μm

