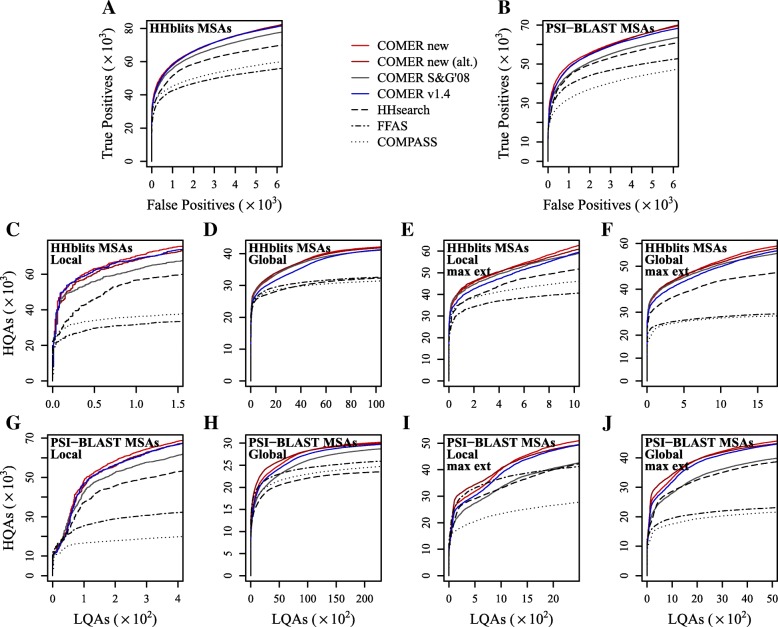
Fig. 5.
Performance of profile-profile alignment methods. (a,b): Sensitivity. (c–j): Alignment quality evaluated in the (c,e,g,i) local and (d,f,h,j) global evaluation modes. Maximally extended (max ext) COMER and HHsearch alignments are evaluated in (e,f,i,j). Profiles were constructed from (a,c–f) HHblits and (b,g–j) PSI-BLAST MSAs. COMER new (alt.) represents the COMER method using the model with E-value correction. COMER S&G’08 implements a statistical model based on previous research. COMER v1.4 represents the previous version of the COMER method. The color coding matches that of Fig. 4. HQA, high-quality alignment. LQA, low-quality alignment

