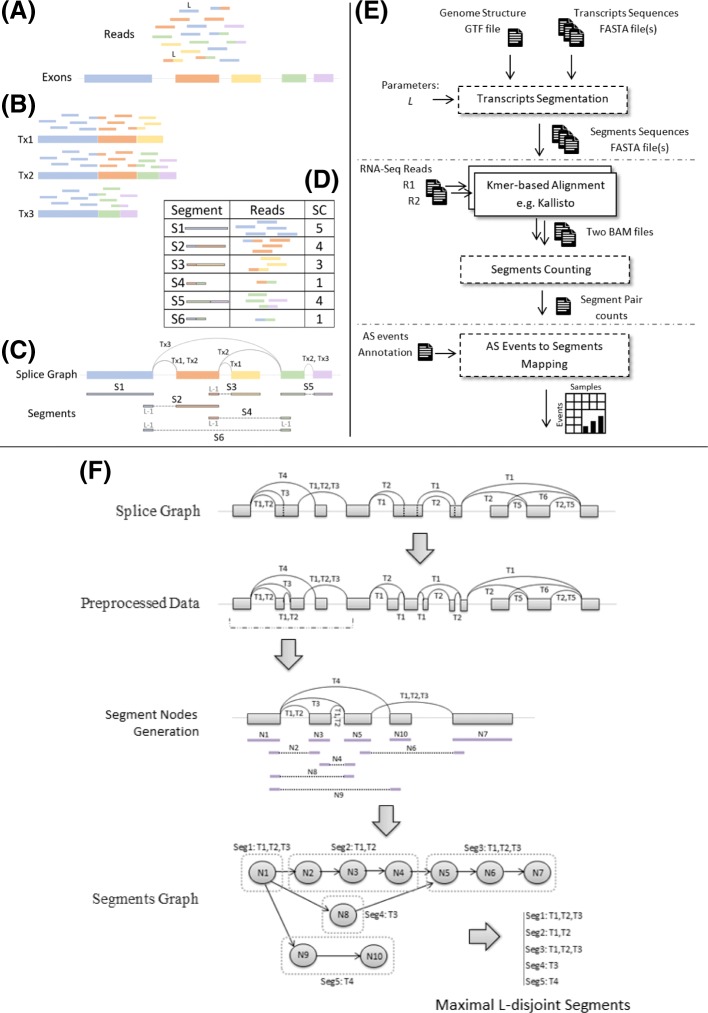
Fig. 1.
An overview of transcriptome segmentation and Yanagi-based workflow. (a) Shows the example set of exons and its corresponding sequenced reads. (b) shows the result of alignment over the annotated three isoforms spliced from the exons. (c) shows the splice graph representation of the three isoforms along with the generated segments from yanagi. (d) shows the alignment outcome when using the segments, and its segment counts (SCs). (e) Yanagi-based workflow: segments are used to align a paired-end sample then use the segments counts for downstream alternative splicing analysis. Dotted blocks are components of Yanagi. (f) Yanagi’s three steps for generating segments starting from the splice graph for an example of a complex splicing event. Assuming no short exons for simplicity. Step two and three are cropped to include only the beginning portion of the graph for brevity

