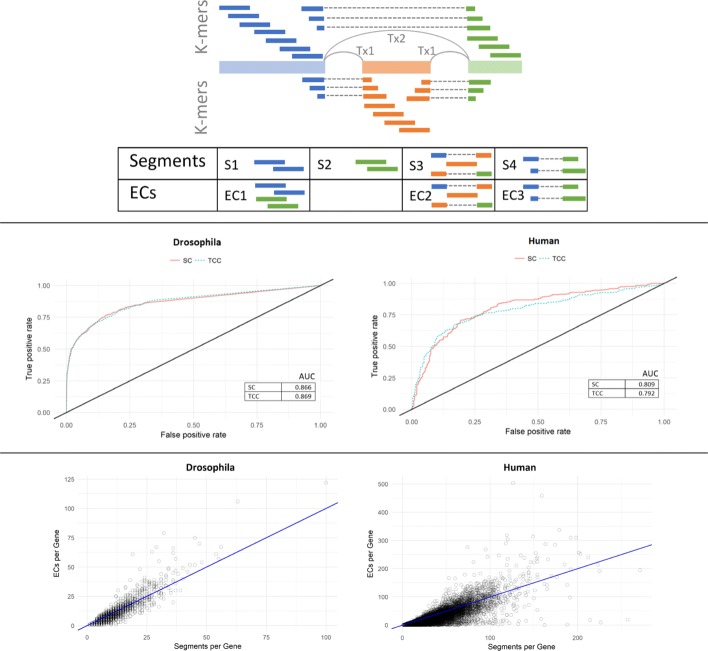
Fig. 3.
Segment-based gene-level differential expression analysis. (Top) Diagram showing an example of two transcripts splicing three exons and their corresponding segments from Yanagi versus equivelance classes (ECs) from kallisto. K-mer contigs from the first and last exons are merged into one EC (EC1) in kallisto while Yanagi creates two segments, one for each exon (S1, S2), hence preserving their respective location information. Both Kallisto and Yanagi generate ECs or segments corresponding to exon inclusion (EC2, S3) and skipping (EC3, S4). (Middle) ROC curve for simulation data for DEX-Seq based differential gene-level differential expression test based on segment counts (SC) and Kallisto equivalence class counts (TCC) for D. melanogaster and H. sapiens. (Bottom) Scatter plot of number of segments per gene (x-axis) vs. Kallisto equivalence classes per gene (y-axis) for the same pair of transcriptomes

