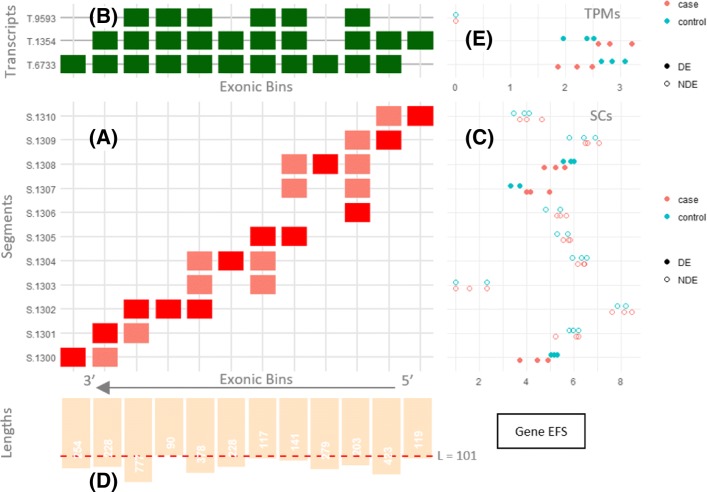
Fig. 4.
Visualizing segments and segment counts of a single gene with differentially expressed transcripts. It shows human gene EFS (Ensembl ENSG00000100842). The gene is on the reverse strand, so the bins axis is reversed and segments are created from right to left. (a) Segment-exonic bin membership matrix, (b) Transcript-exonic bin membership matrix. (c) Segment counts for three control and three case samples, fill used to indicate segments that were significantly differential in the gene. (d) Segment length bar chart, (e) (optional) Estimated TPMs for each transcript

