Fig. 7.
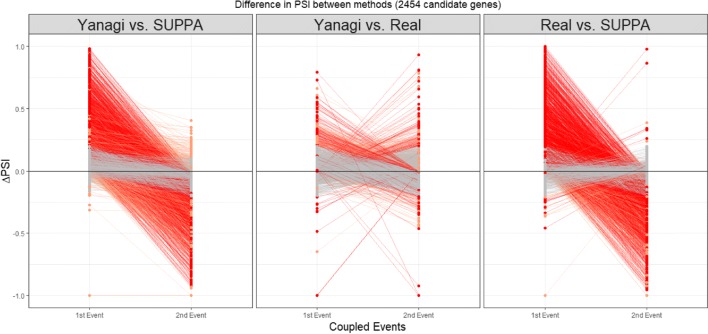
Trends of error in event PSI values across methods. ΔPSI of an event is calculated here as the difference in the calculated PSI of that event obtained either by Yanagi, SUPPA, or the truth. For each coupled event, a line connecting ΔPSI of the first event to the second’s is drawn to show the trend of change in error among the first and second event in each pair. Overestimation-to-underestimation (and underestimation-to-overestimation) trends are colored red. Orange colored trends represent trends where both events were either overestimated or underestimated. Trends with insignificant differences (|ΔPSI|<0.2) are colored grey

