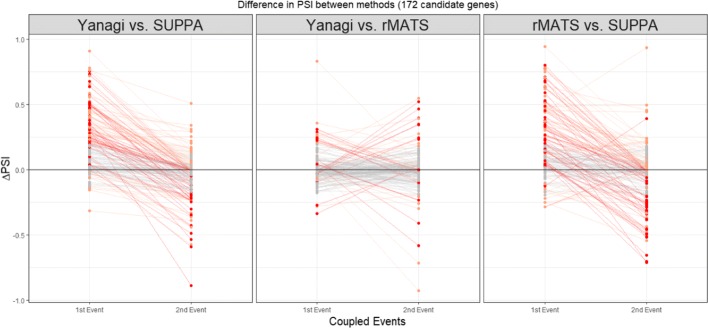
Fig. 8.
Trends in ΔPSI across methods Yanagi, SUPPA, rMATS for 172 coupled events in candidate genes for incomplete annotation in drosophila melanogaster (SRR3332174). Overestimation-to-underestimation (and underestimation-to-overestimation) trends are colored red. Orange colored trends represent trends where both events were either overestimated or underestimated. Trends with insignificant differences (|ΔPSI|<0.2) are colored grey. Out of the 172 cases, 33% showed Overestimation-to-underestimation (or underestimation-to-overestimation) trends in Yanagi-SUPPA, 11% in Yanagi-rMATS, 29% in rMATS-SUPPA

