Fig. 9.
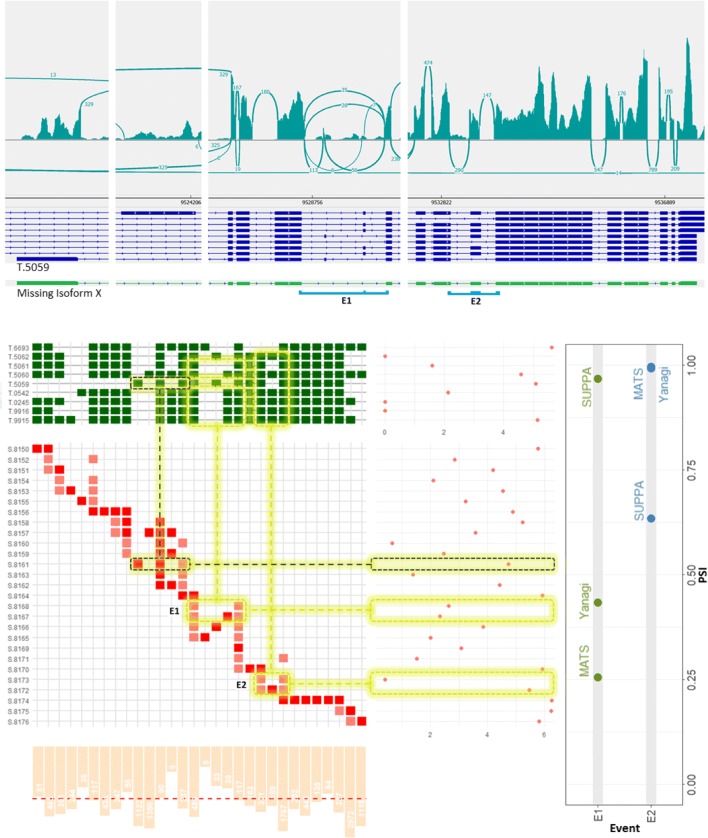
The Bruchpilot gene in Drosophila melanogaster (SRR3332174) serves as an example of a gene likely to have incomplete annotation. (Bottom-Right) The PSI values of the coupled events E1 and E2 exhibit severe overestimation and underestimation, respectively, by transcript-based approaches compared to Yanagi and rMATS. (Top) illustrates read coverage across the gene prepared using IGV, aligned with the 9 annotated isoforms. (Bottom-Left) The segments visualization of the gene is compared to transcript-level expression (TPM) obtained from kallisto, and the segment counts (normalized) from Yanagi’s pipeline. Refer to section 3 for details on this panel’s components. Postulating a isoform X (shown as a green-colored track on the top panel) missing from the annotation explains the deviation in both PSI values and the inconsistency in coverage across transcript T.5059

