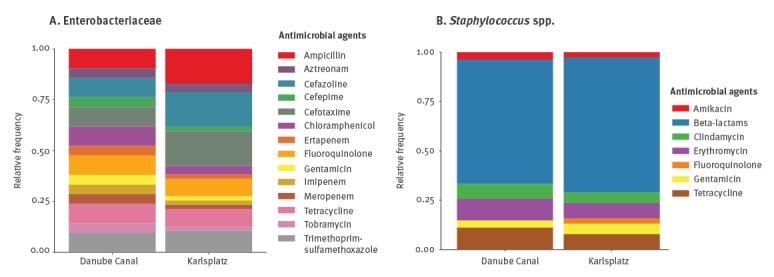
Figure 3.
Relative frequencies of antimicrobial resistance phenotypes at each investigated site in (A) Enterobacteriaceae and (B) Staphylococcus spp. isolates, Vienna, Austria, 13 September 2016–6 June 2017 (n = 44)
These graphs represent the relative frequency (proportion between 0 and 1) of AMR phenotype. The sum of the relative frequencies of all AMR phenotypes per site for each bacterial group is 1.0.

