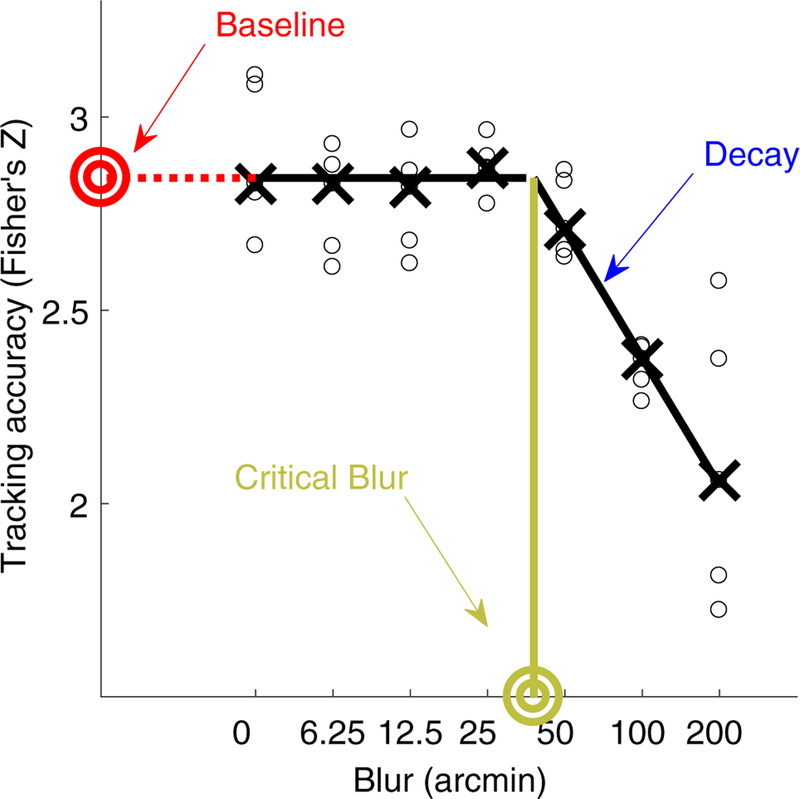
Fig. 4.
Example of individual tracking data fitted with a hinged-line function. Tracking accuracy as a function of blur for a representative observer in the binocular blur, finger tracking, horizontal pursuit condition. Black circles are individual trial accuracy data. Black crosses are medians. Black lines are the fitted hinged-line linear-log function. The y-axis intercept is the baseline level of accuracy (red bullseye). Beyond the critical blur level (green bullseye), accuracy begins to falls below the baseline level of tracking. The slope of the linear falloff (indicated by the blue arrow) is the rate of decay of tracking accuracy with increasing levels of blur

