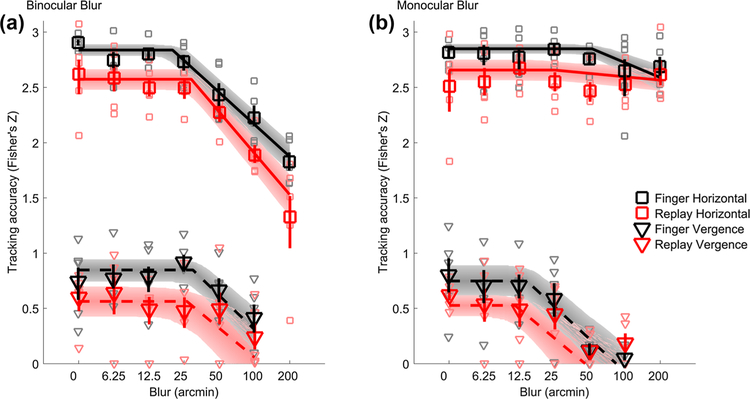
Fig. 5.
Tracking accuracy. Tracking accuracy at each blur level for binocular (a) and monocular (b) blur conditions. Data from horizontal pursuit eye movements are shown as squares and vergence pursuit eye movements as triangles. Finger tracking data are shown in black and replay tracking are in red. Large symbols represent average tracking accuracy across subjects at each blur level. Error bars are 68% confidence intervals. Small symbols represent individual subject data. Solid and dashed lines are the average best fits of a hinged-line linearlog function for horizontal pursuit and vergence pursuit, respectively. Shaded regions are 68% confidence regions of the fitted functions. Note that the y-axis is scaled following Fisher’s Z transformation, whereas the x-axis is log scaled

