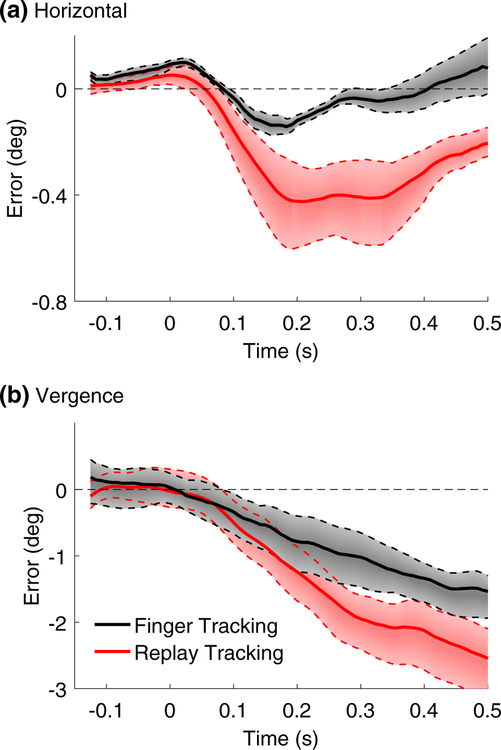
Fig. 8.
Time course of tracking error. Tracking error (the difference between gaze and finger position) is plotted as a function of time from target movement onset for a horizontal pursuit and b vergence pursuit tracking. Positive error values signify that the eyes were leading the target, while negative errors signify that the eyes were trailing the target. Black and red curves show the error in the finger and replay tracking conditions, respectively, averaged across all monocular and binocular blur conditions. Shaded regions bounded by dotted lines show 68% confidence intervals of the mean error trace. Note that the y-axes in a, b are scaled differently

