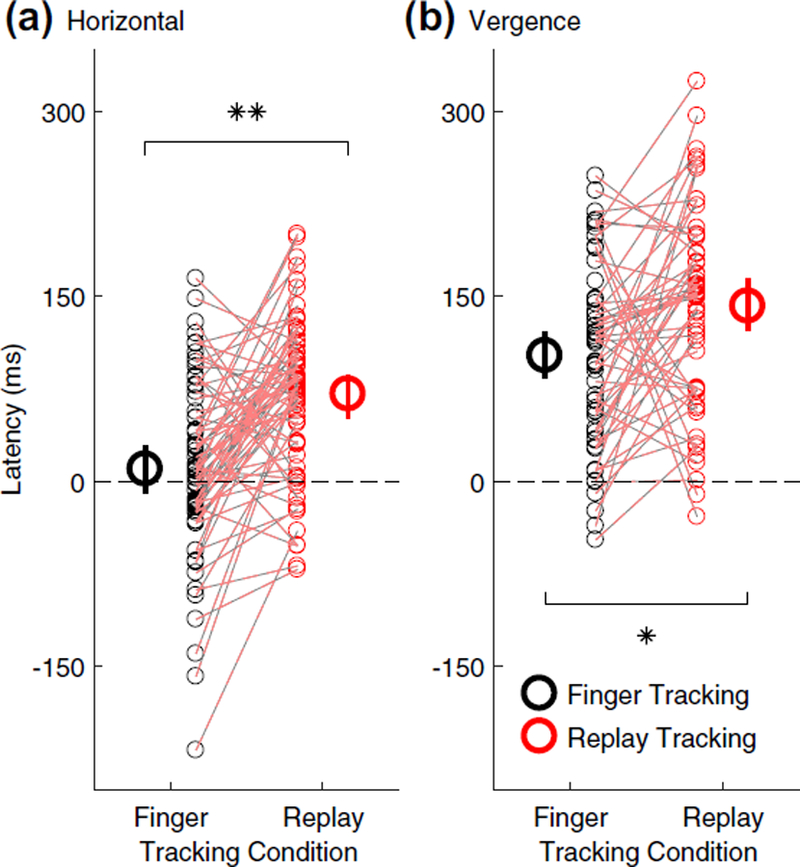
Fig. 9.

Tracking latency. Latency of gaze tracking (i.e., the difference between target and eye movement onset in milliseconds) for a horizontal pursuit and b vergence pursuit tracking. Black circles represent finger tracking, red circles represent replay tracking, small symbols represent individual subject data, and dashed red-black lines connect data points belonging to individual subjects from matching blur conditions. Large symbols are mean estimates of tracking latency in the finger and replay tracking conditions, averaged across all monocular and binocular blur conditions. Error bars are 95% confidence inter vals. Negative latencies indicate anticipatory eye movements. *p < 0.05, **p < 0.01
