Figure 4.
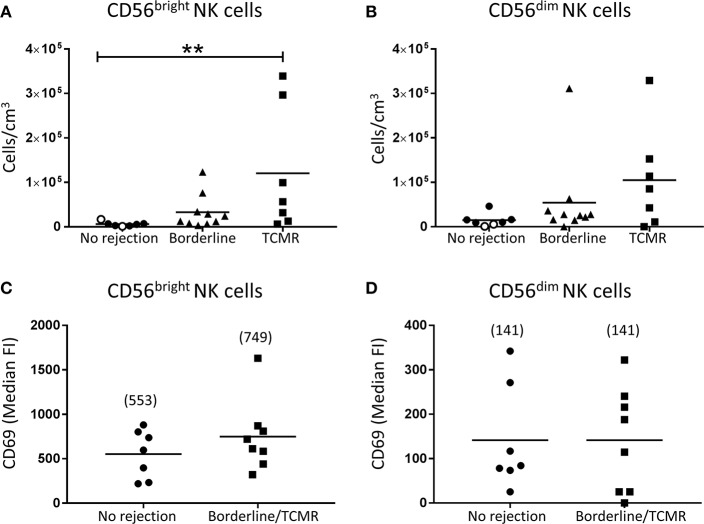
Significantly increased CD56bright NK cells in TCMR. (A,B) Absolute numbers of total (A) CD56bright NK cells and (B) CD56dim NK cells in kidney transplant biopsy tissue with histopathological diagnosis of no rejection (n = 7), borderline cellular rejection (n = 10) and T cell-mediated rejection (TCMR; grades I–II; n = 7). Values for individual donors are presented; donors with DSA are identified using open symbols; bars represent means. (C,D) Surface expression of CD69 on (C) CD56bright NK cells and (D) CD56dim NK cells in kidney transplant biopsy tissue with histopathological diagnosis of no rejection (n = 7) and borderline or T cell-mediated rejection (n = 8). Median fluorescence intensity (median FI) values for individual donors are presented; bars represent means, with mean values presented in parentheses. **P < 0.01, Kruskal-Wallis test with Dunn's post-test.

