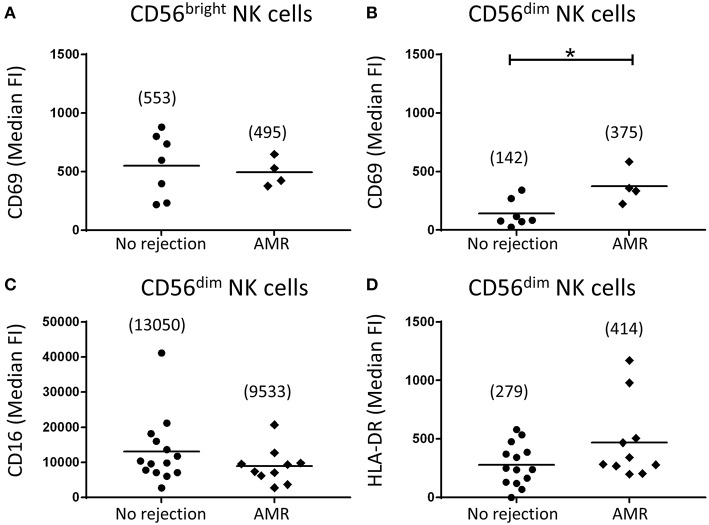
Figure 6.
Human CD56dim natural killer (NK) cells in AMR biopsies display an activated phenotype. (A,B) Surface expression of CD69 on CD56bright NK cells (A) and CD56dim NK cells (B) in biopsy specimens without (no rejection; n = 7) and with AMR (n = 4). (C,D) Surface expression of (C) CD16 and (D) HLA-DR on CD56dim NK cells in biopsy specimens without (no rejection; n = 14) and with AMR (n = 10). Median fluorescence intensity (median FI) values for individual donors are shown; bars represent means, with mean values presented in parentheses. *P < 0.05, Mann-Whitney test.

