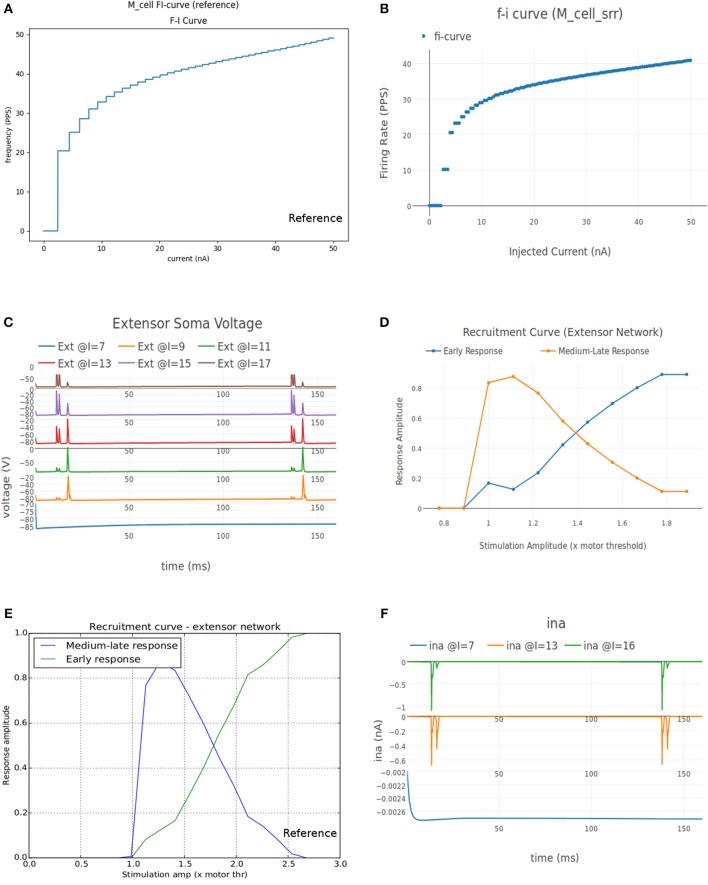
Figure 8.
(A) FI curve of the reference motoneuron cell model derived from Courtine et al. (2016). (B) FI curve of M_cell_srr, a motoneuron model in NEUROiD. The rheobase of this model is close to 3nA, same as the reference model in (A). (C) The extensor soma voltage for various EES stimulations, averaged over all the cell instances in the cell group. It is seen that the early response activation (first set of spikes after 125 ms) increases with increase in EES stimulation magnitude, but the medium-late response (second set of spikes after 125 ms) first increases and then decreases. The bottom most plot (shown in blue) in the figure is obtained for an EES stimulation of 7 mA. The stimulation amplitude is increased in steps of 2 mA to obtain other plots. (D) Spinal reflex recruitment curves elicited by EES Stimulation of the extensor network simulated in NEUROiD. The medium-late response reduces to less than 20% of its peak value when input stimulation is twice the motor threshold. (E) Spinal reflex recruitment of extensor group, reproduced from Courtine et al. (2016). The early and medium-late response is plotted here. Similar to (D), we see that the medium-late response reduces to less than 20% of its peak value when input stimulation is twice the motor threshold. (F) The Na+ ion current is recorded and plotted for various EES stimulations.

