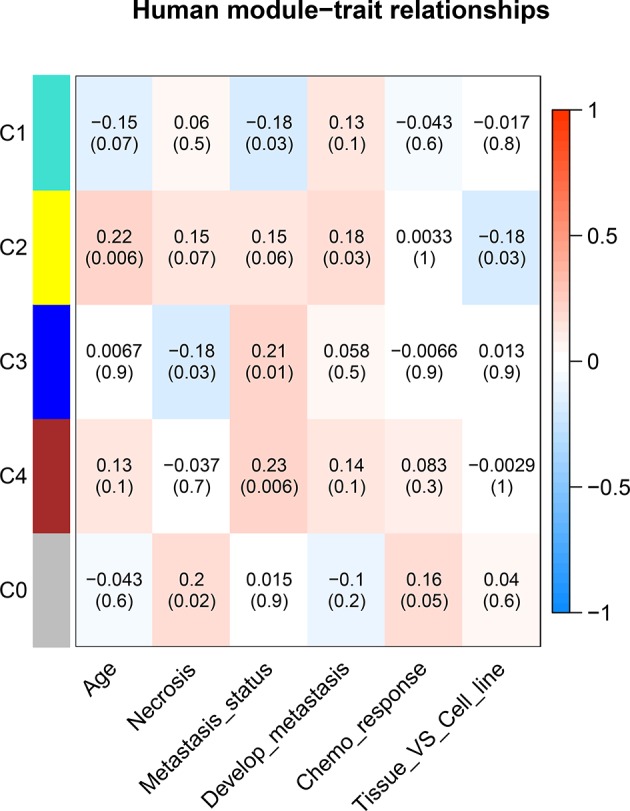
Figure 5.

Correlation between consensus modules and clinical traits in humans. The red color represents a positive correlation, the darker the color the higher the correlation. The top number in each cell indicates the correlation coefficient, and the bottom number indicates the correlation significance (p value).
