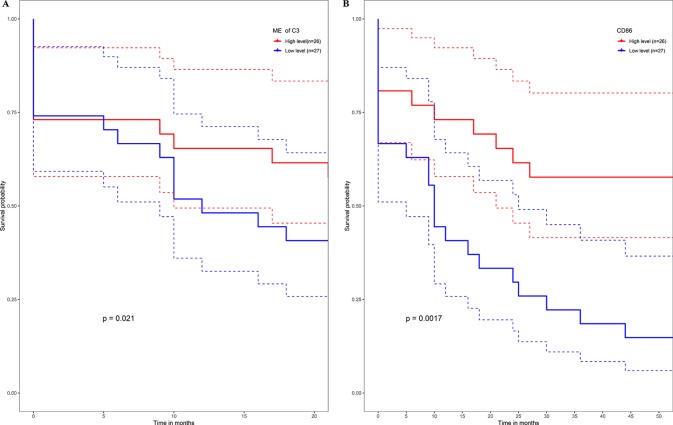
Figure 9.
High expression level of C3 ME (A) or CD86 ME (B) showing significant higher rate of metastasis-free survival. (Red solid line: survival curves of high expression samples of selected gene in comparison with the median expression level. Blue line: survival curves of low expression samples of selected gene in comparison with the median expression level. Dotted line: the upper and lower limits of 95% confidence interval).

