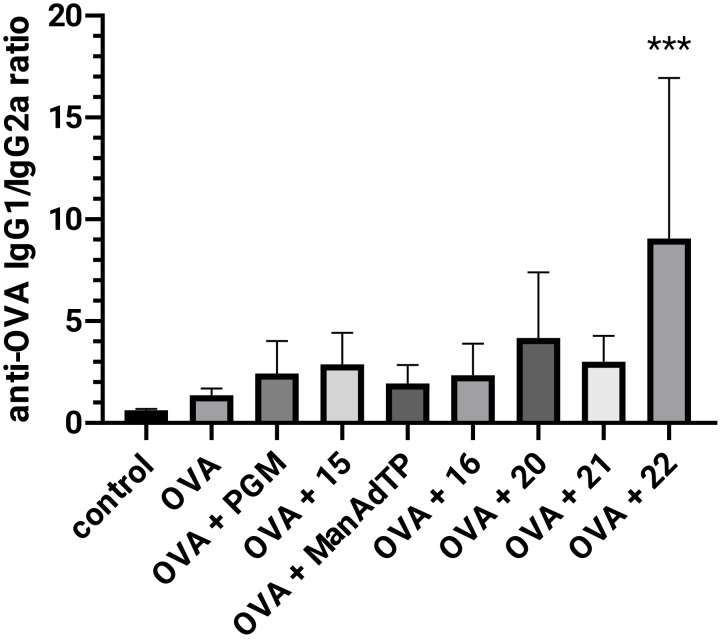
Figure 6.
The ratio of anti-OVA IgG1 and anti-OVA IgG2a (IgG1/IgG2a) in BALB/c mice. For each mouse serum IgG1/IgG2a was calculated and the result for each experimental group (n = 5) is presented as average ± standard deviation (SD). ***p < 0.001 denote statistical significance in comparison to the control group.

