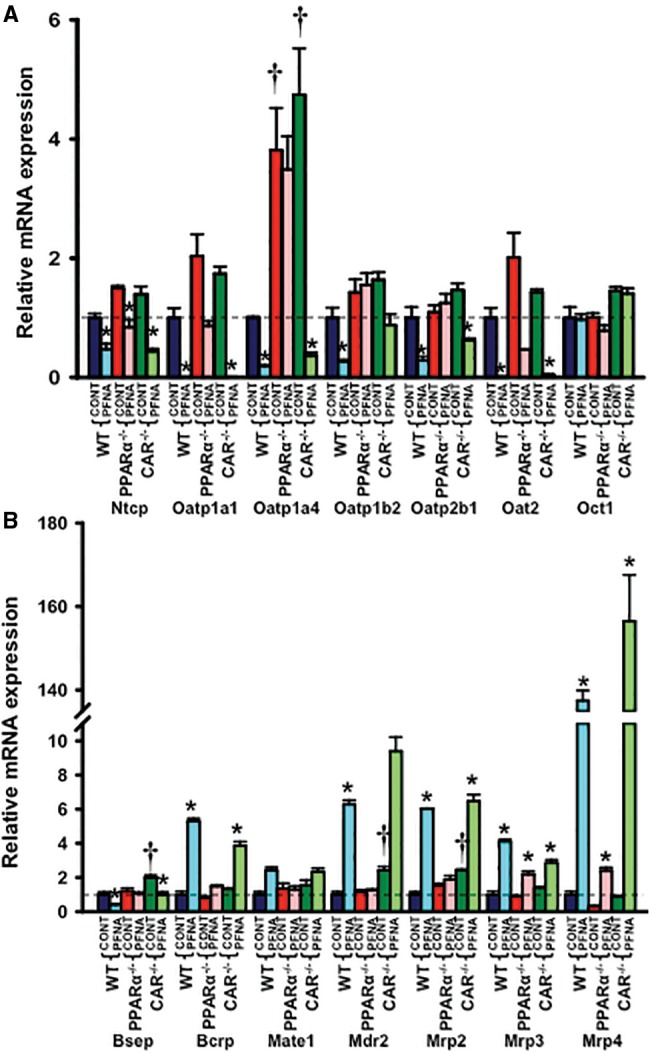
Figure 7.

Messenger RNA expression of (A) uptake and (B) efflux transporters in WT, PPARα-null, and CAR-null mouse livers after PFNA exposure. The data are presented as mean ± SEM (n = 5/exposure). Asterisks (*) represent a statistical difference (p < .05) between control and PFNA exposure in mice of the same genotype. Single daggers (†) represent a statistical difference (p < .05) between WT and PPARα-null/CAR-null mice.
