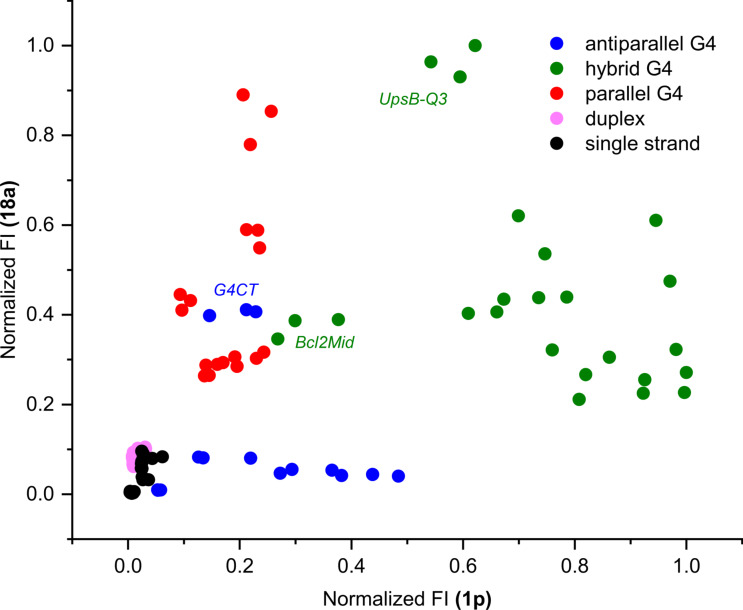
Figure 8.
Dual-dye conformational analysis of an extended panel of 33 DNA oligonucleotides. This is performed on normalized datasets (data referring to each of the two dyes are normalized separately), plotting the resulting fluorescence of compound 18a against that of compound 1p. Data for each target are presented as independent triplicates.

