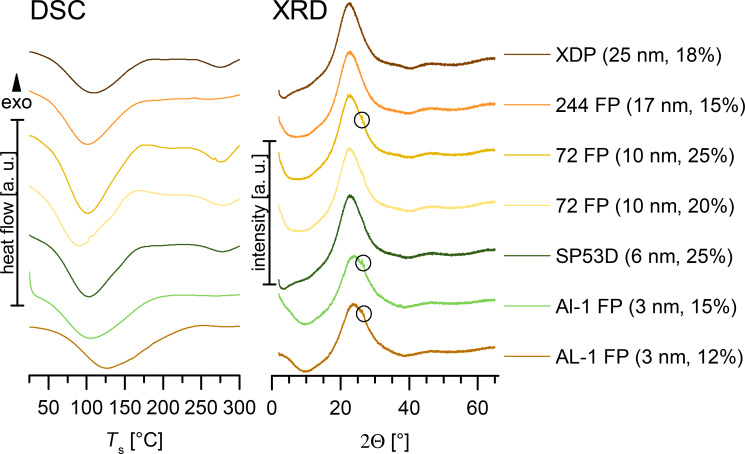
Figure 5.
DSC thermograms (left) and XRD diffractograms (right) for selected silica nanoparticles, all loaded using ethanol as the solvent for rutin, showing curves with highest amorphous loading. For 72 FP (10 nm pores) the curves obtained with the overloaded system (25%) are also shown, and for AL-1 FP, only overloaded curves are presented (pore size 3 nm, 12% and 15% loading).

