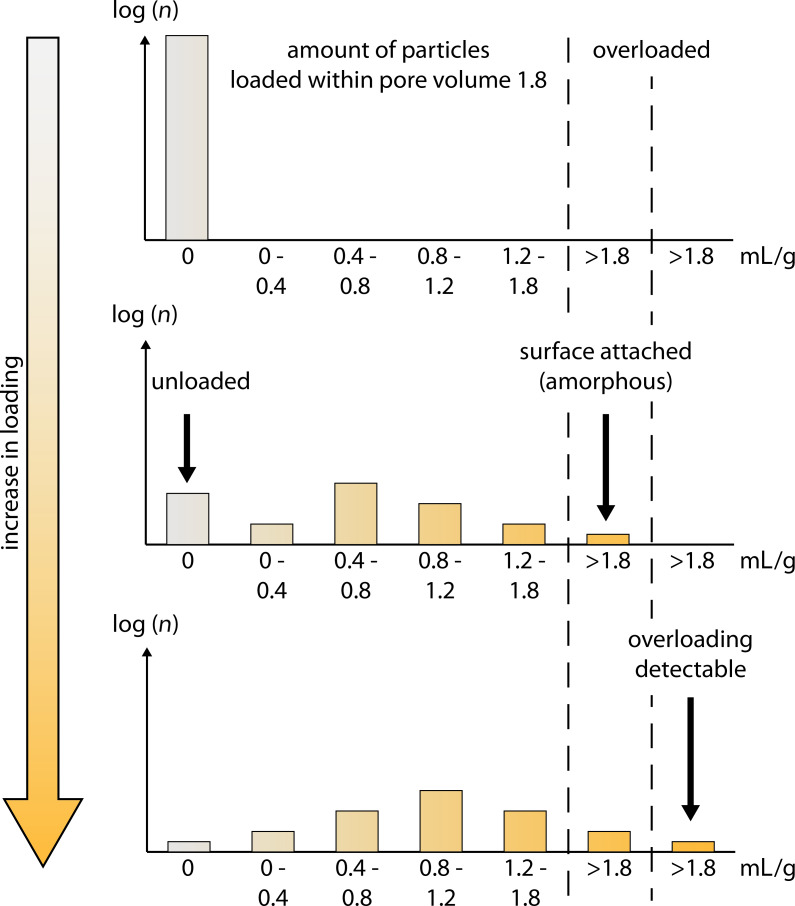
Figure 7.
Description of the silica particle loading mechanism showing the distribution of differently filled particles as a function of loading. Upper plot: in the unloaded state, all particles fall within the 0 mL/g fraction. Middle plot: maximum loading condition where no crystallinity was detectable by XRD; the particles are filled to various extents, possibly with some being overloaded (>1.8 mL/g). Lower plot: some particles are obviously overloaded; the population contains a particle fraction in which detectable crystallization occurred.

