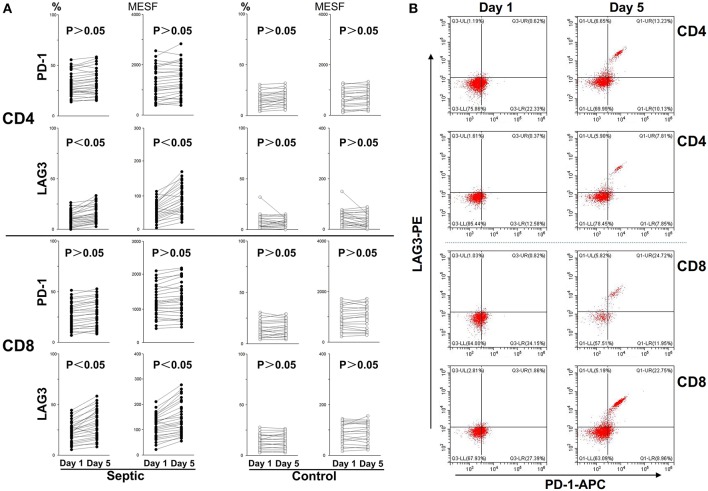
Figure 4.
Changes in LAG3 and PD-1 expression on CD4 and CD8 T cells over the course of acute sepsis. The lines connect values at enrollment and the 5th day after the onset of sepsis or on the 5th day in the control group. The positive proportion and MESF values were obtained as described in the procedures. Scattergram (A) showed the expression changes of LAG3 and PD-1 on CD4 and CD8 Tcells, respectively. Representative flow cytometry pictures of sepsis group from day 1 to day 5 (B). As there were no significant changes in the control group from day 1 to day 5, we did not present representative images. P-values were calculated with a 2-tailed, non-parametric Wilcoxon matched pairs test.

