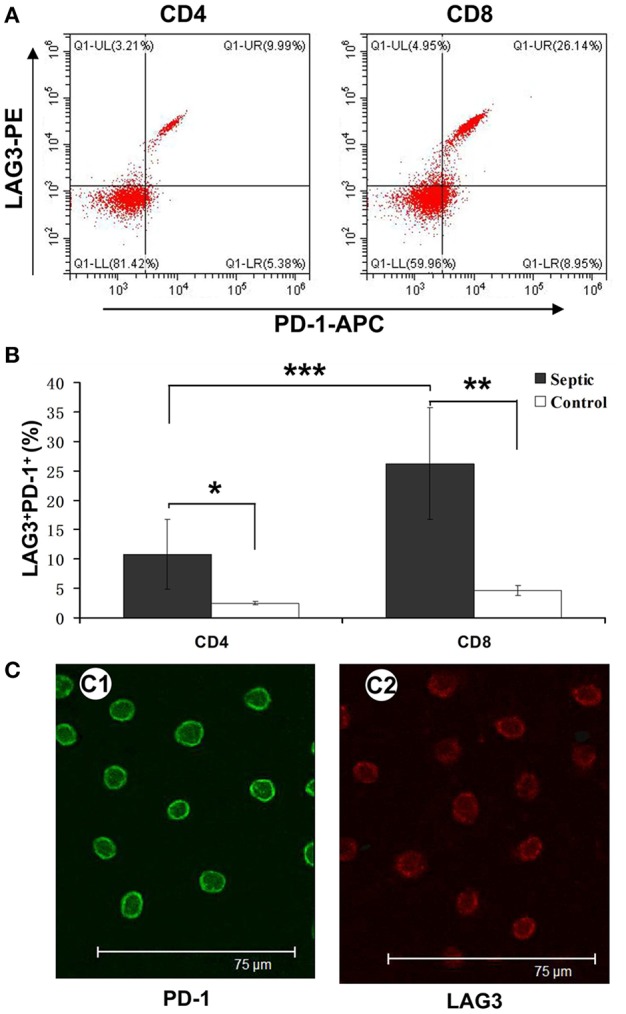
Figure 5.

Determination of the coexpression of LAG3 and PD-1 on CD4 and CD8 T cells over the course of acute sepsis. Peripheral blood was collected at enrollment and again 5 days later from patients with sepsis and normal controls. We could directly observe T cells with high expression of LAG3 and PD-1 by immunofluorescence (C). After analysis by flow cytometry for the expression of the indicated markers on CD4- and CD8-positive T cells, the ratio of CD8+ T cells with LAG3 and PD-1 coexpression was close to 25% and higher than that of CD4+ T cells, which was approximately 8% (A); ***P < 0.05 CD4+ T cells vs. CD8+ T cells in sepsis (B). However, both ratios were significantly higher than those for the control group; *P < 0.05 and **P < 0.05, respectively (B). Data are presented as mean ± SEM, Student's t-test was employed.
