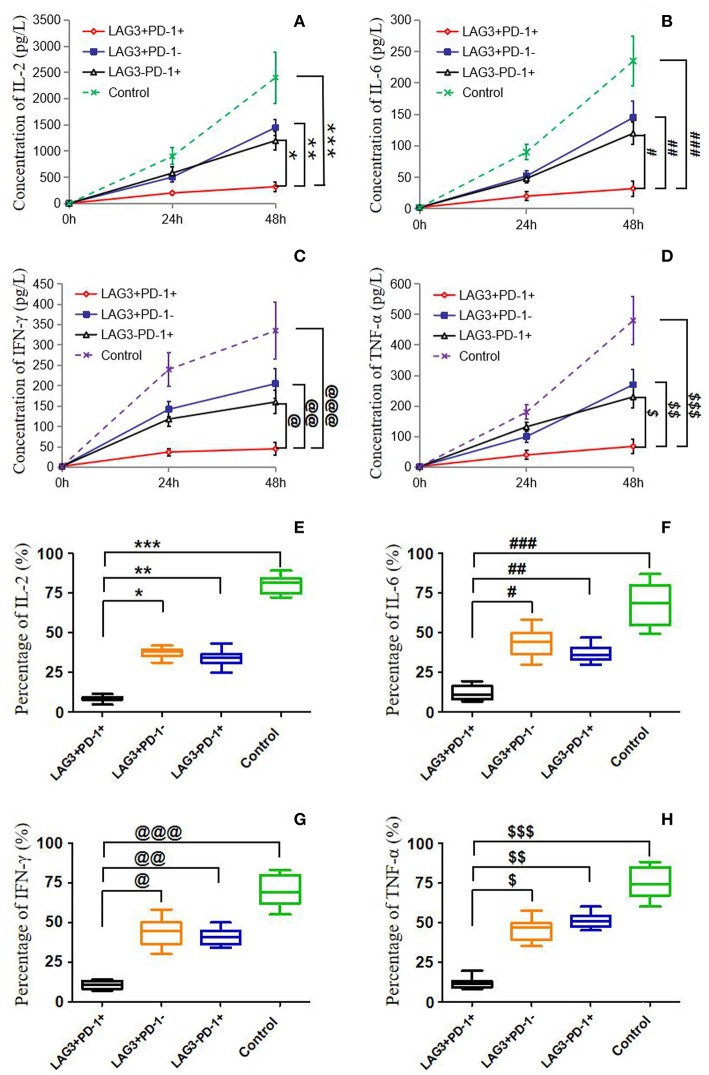
Figure 6.
Determination of the cytokine secretion by T cells with single- or double-positive expression of LAG3 and PD-1. As described before, T cells with different phenotypes were sorted via FACS, cultured in 24-well plates, activated by α-CD3/α-CD28 and stimulated with PMA (50 ng/ml) and ionomycin (500 ng/ml) for 48 h. Cytokine concentrations in the supernatant were determined by ELISA (A–D), and intracellular cytokine levels were measured by flow cytometry (E–H). IL-2 (A,E) and IL-6 (B,F) were measured mainly to evaluate the function of CD4+ T cells, and IFN-γ (C,G), and TNF-α (D,H) were measured mainly to detect the function of CD8+ T cells. There was a common trend in cytokine secretion capacity, that is, the function of LAG3 and PD-1-coexpressing T cells was significantly weaker than that of LAG3 or PD-1 single-positive T cells and control T cells; *P < 0.05, **P < 0.05,***P < 0.05; @P < 0.05, @@P < 0.05, @@@P < 0.05; #P < 0.05, ###P < 0.05, ###P < 0.05; $P < 0.05, $$P < 0.05, and $$$P < 0.05. In particular, the T cells coexpressing LAG3 and PD-1 exhibited decreased cytokine secretion that was more than 2-fold lower than the secretion of the single-positive T cells. Data of (A–D) are expressed as the mean ± SEM, and One-way ANOVA with Tukey's multiple comparison test was used. Data of (E–H) are shown as a box plot and analyzed using the Kruskal-Wallis Test due to variance inhomogeneity.

