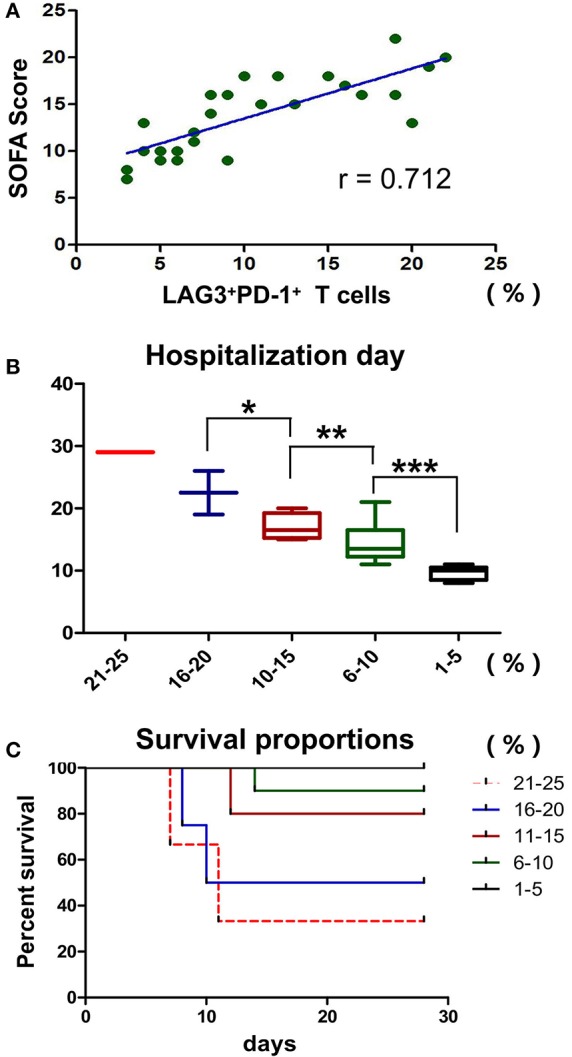
Figure 9.

Effects of T cells with LAG3 and PD-1 double-positive expression on the clinical indicators and prognosis of patients with sepsis. The proportion of coexpressing T cells was positively correlated with the SOFA score using Pearson's simple correlation coefficient (r = 0.712, 95%CI: 0.448 to 0.862, P < 0.0001) (A). Due to the small number of patients, we compared the proportions of LAG3 and PD-1-coexpressing T cells by subgroups in the mortality and survival analyses, and we set 5% as the group increment. The numbers of patients with 1–5%, 6–10%, 11–15%, 16–20%, and 21–25% double-positive T cells were 5, 9, 5, 4 and 3, respectively. The higher the proportion of coexpressing T cells was, the longer the hospital stay (*P < 0.05, **P < 0.05, and ***P < 0.05) (B), analyzed by Kruskal-Wallis Test. For the survival analysis, a log-rank test was performed. We found that there were differences in survival among the high-proportion subgroups (P < 0.05, a vs. b; P < 0.05, a vs. c; P < 0.05, b vs. c; P < 0.05, a vs. d; and P < 0.05, a vs. e) and no differences among the low-proportion subgroups (P > 0.05, e vs. d and P > 0.05, d vs. c) (C).
