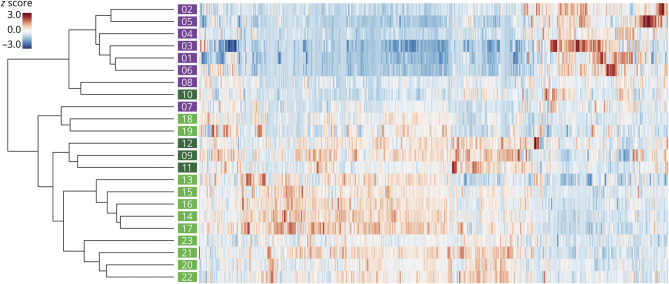
Figure 2. Unbiased discovery of a molecular phenotype in patients with PACNS.
Dendrogram (left) depicts the distance between samples (sample identifiers shown at branch tips). Two major clusters emerge from an unbiased clustering analysis: top, containing mostly primary angiitis of the CNS (PACNS) samples (purple); and bottom, containing noninflammatory control (light green) and reversible cerebral vasoconstriction (dark green) samples. Heat map displays levels of 651 proteins for every sample as a by-protein z score. Hierarchical clustering was performed by applying the unweighted pair group method with arithmetic mean method to the correlation distance matrix. Length of horizontal lines on the dendrogram represents the distance between samples.

